
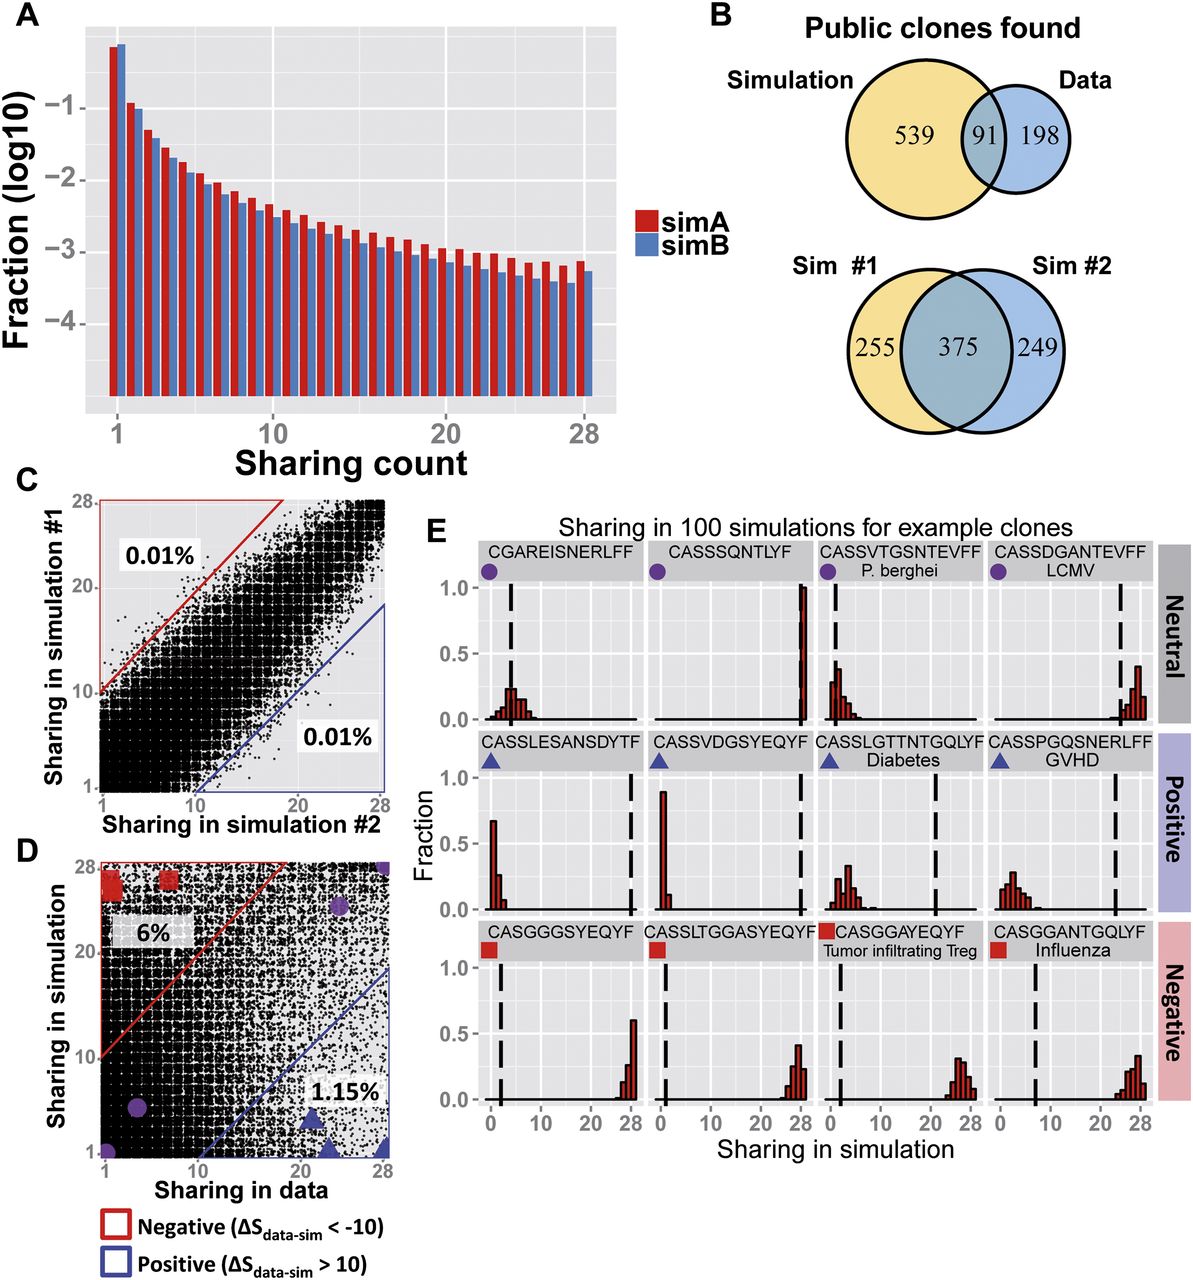
Simulations of the VDJ recombination process provide a measure for the impact of biases on sharing levels. (A) The fraction of CDR3 aa sequences found in each sharing category, in two implementations of simulation of the biased VDJ
recombination process (see Methods for details). Both simulation A (red) and simulation B (blue) show a similar trend to that
observed in the data (Fig. 1B), where 0.08% and 0.05% of CDR3 sequences are public, respectively. (B) A modest overlap of public CDR3-types is found between simulation and data, with only 91 CDR3 aa sequences found to be public
in both (top plot). Higher overlap in public sequences exists between independent iterations of the simulation (bottom). (C) Sharing is well correlated between two independent iterations of simulation A. Only a very small number of CDR3 sequences
differ by more than 10 in their sharing level between the two runs of the simulation. (D) A comparison of sharing level between simulation (y-axis) and data (x-axis). Each dot represents one CDR3 aa sequence. (Red region) 6% of the sequences show much lower sharing in the data ( ). (Blue region) 1.15% of the sequences show much higher sharing in the data (
 ). (E) Measured (vertical dashed line) and simulated (red bars, histograms of 100 random runs of simulation A) sharing levels of
four selected CDR3 aa sequences from each region in D. (Top) Neutral, showing similar sharing in simulations and data (purple circles in D,
). (E) Measured (vertical dashed line) and simulated (red bars, histograms of 100 random runs of simulation A) sharing levels of
four selected CDR3 aa sequences from each region in D. (Top) Neutral, showing similar sharing in simulations and data (purple circles in D,  ); (middle) positive, showing much higher sharing in data vs. simulation (blue triangles in D,
  ); (bottom) negative (red squares in D,
  ) showing much lower sharing in the data. Two sequences in each row are taken from the annotated group of sequences shown
in Figure 4.
) showing much lower sharing in the data. Two sequences in each row are taken from the annotated group of sequences shown
in Figure 4.


