
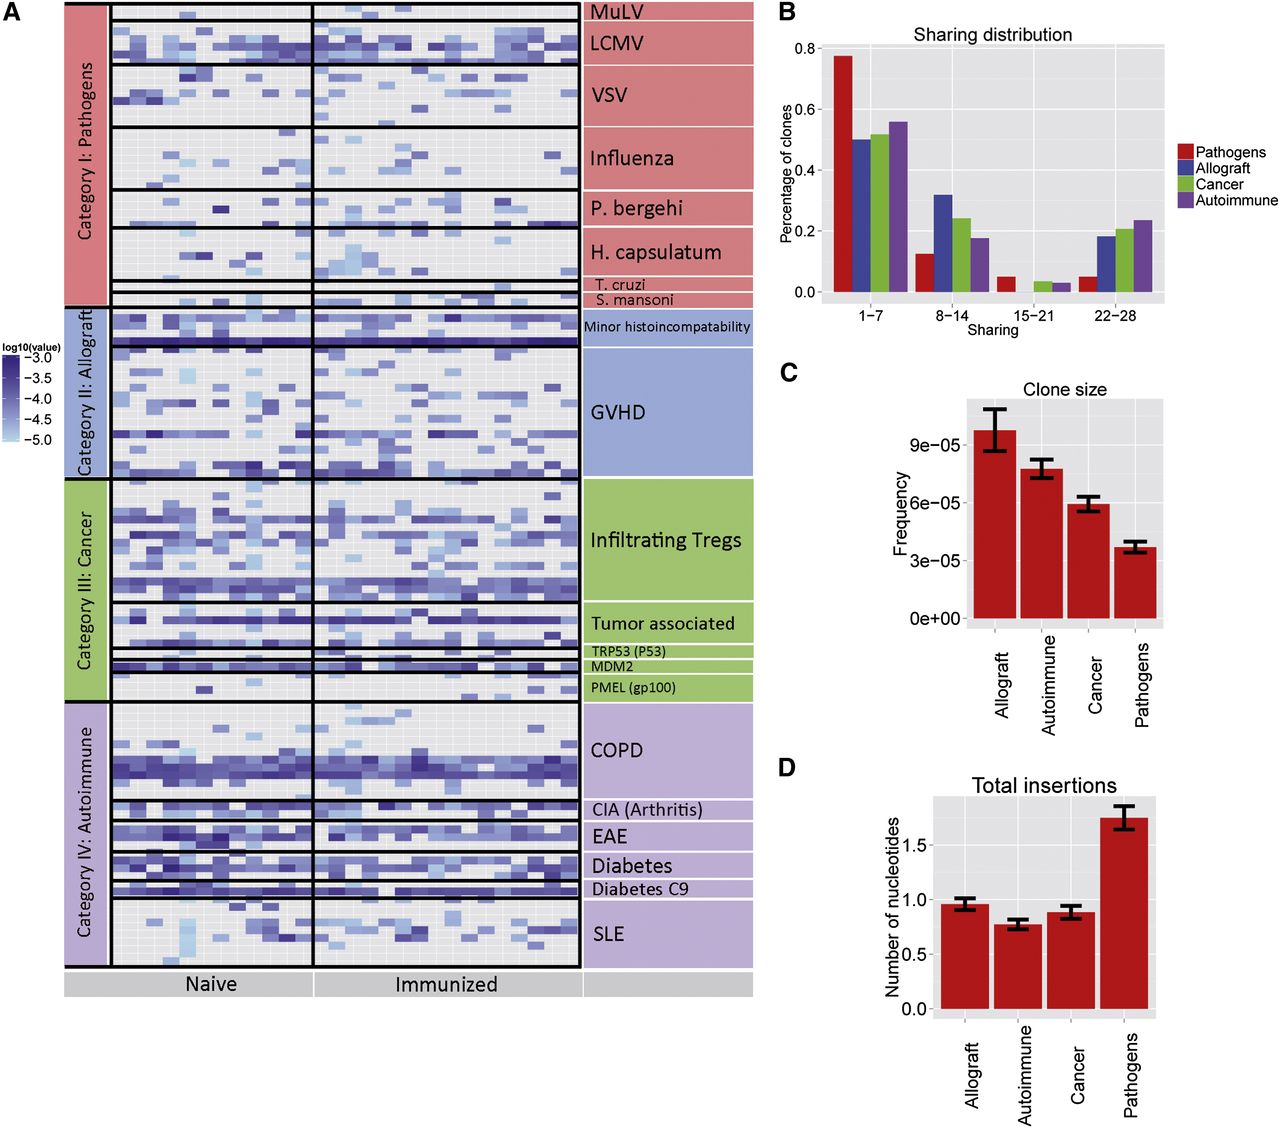
Annotated CDR3 sequences associated with self-related antigens feature a high level of sharing. (A) Frequencies of 124 annotated TCR sequences that were found in our data set. The frequency of each sequence (rows) in each mouse in our data set (columns) is shown (log10 scale, color bar on the left; gray color: sequence not found). Annotated sequences are grouped into four functional categories, according to the model in which they were detected (see Supplemental Table S2). (B) Sharing distributions of the annotated sequences, according to their functional category. (C,D) Comparison of annotated CDR3 aa sequences of the different functional categories, in terms of mean frequency in the 28 tested mice (C) and mean number of nt insertions in the VD and DJ junctions (D).


