
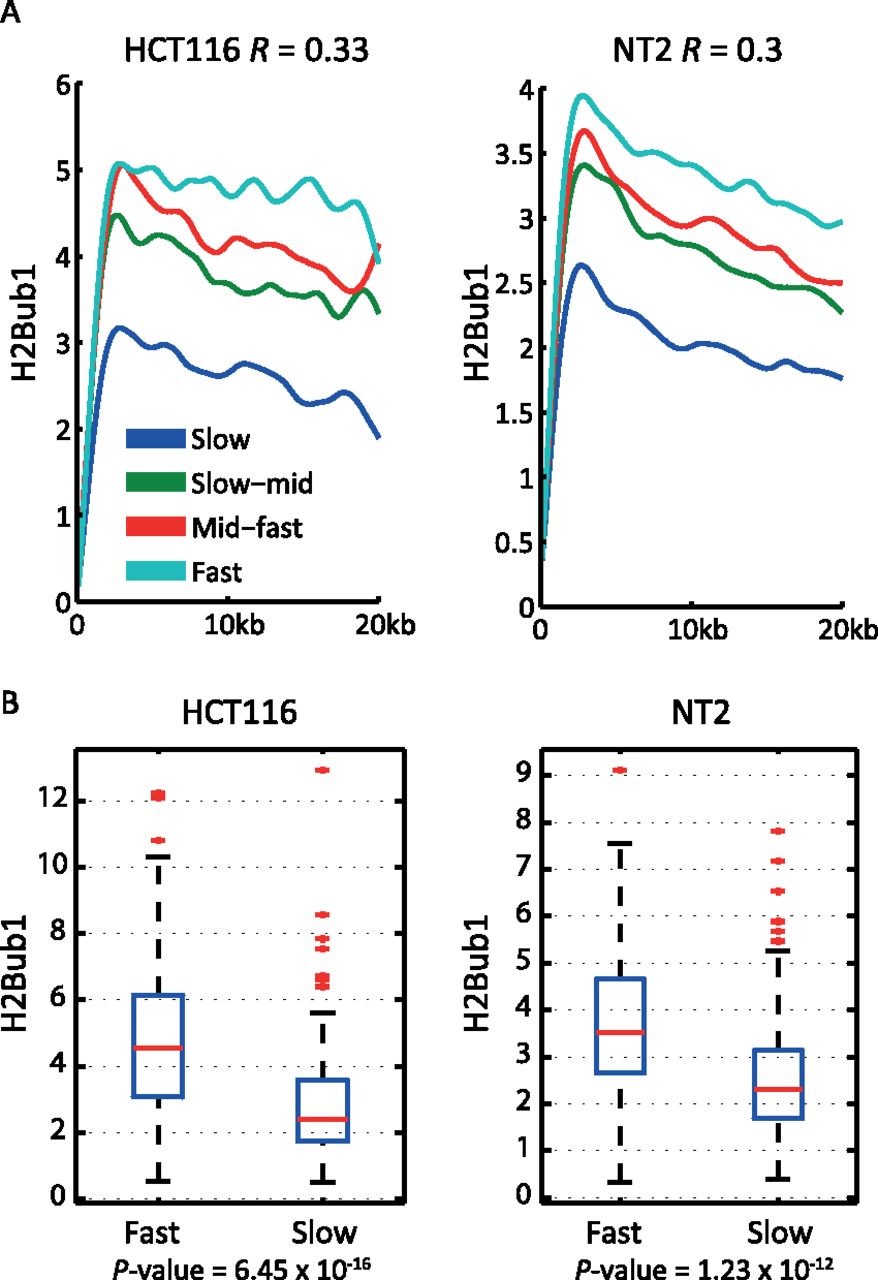
Genome-wide correlation between H2Bub1 levels and elongation rates. (A) Genome-wide transcription elongation rates were determined in HeLa cells by DRB4sU-seq (Fuchs et al. 2014) . Genes longer than 25 kb were ranked according to elongation rate and binned in four equally sized groups (from fastest to slowest: turquoise, red, green, and blue). Mean H2Bub1 ChIP-seq values for the first 20 kb downstream from the TSS in either HCT116 colorectal cancer cells (left) or NT2 cells (right) were plotted for each group. Data were smoothed using cubic spline with parameter 0.001. R denotes the Pearson correlation coefficient between elongation rates and H2Bub1 occupancy. (B) Mean H2Bub1 levels within genes included in the top 25% (“Fast”) or the bottom 25% (“Slow”) elongation rate gene groups, defined as in A. Mean H2Bub1 levels are significantly higher in Fast genes (Student’s t-test; P-values = 6.45 × 10⁻¹⁶ and 1.23 × 10⁻¹² for HCT116 and NT2 cells, respectively).


