
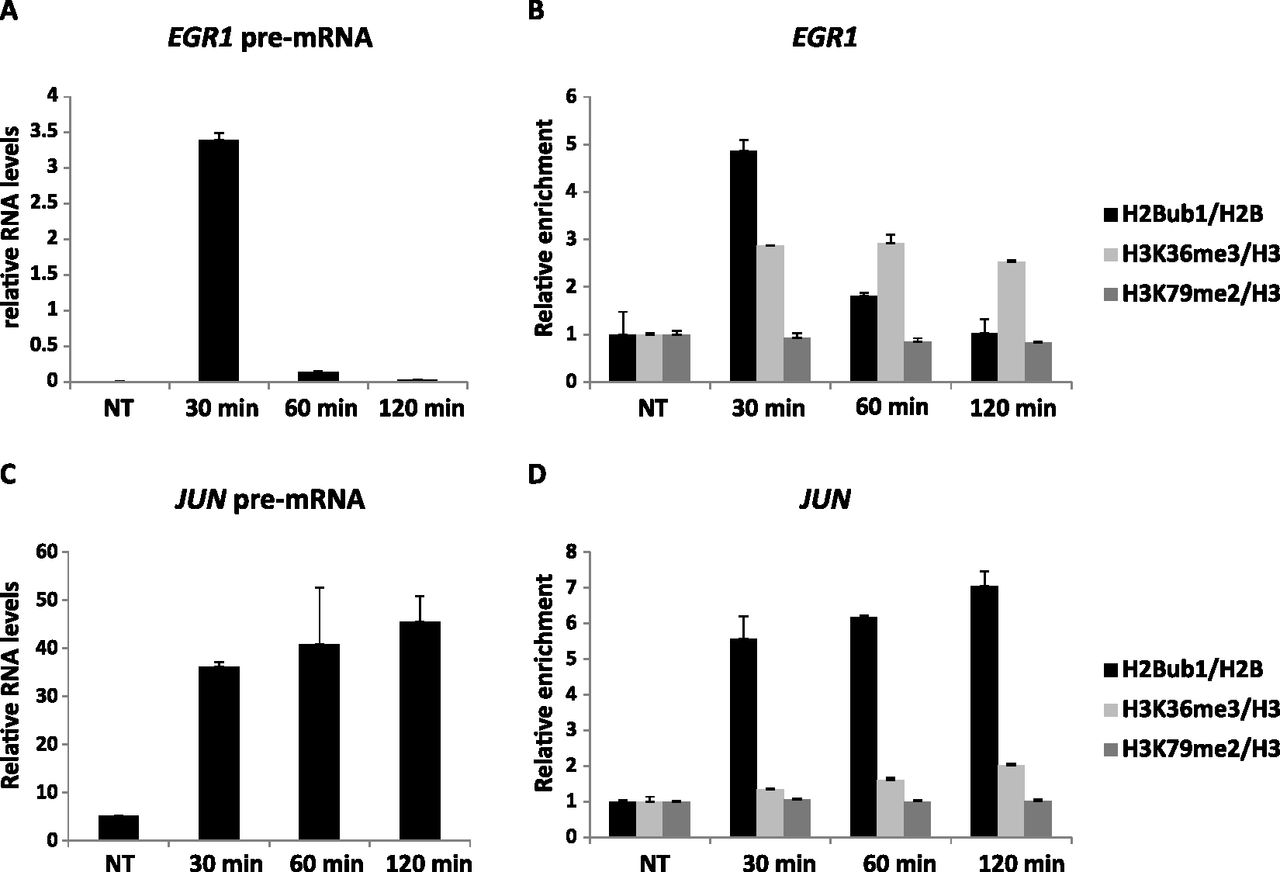
Gene body H2Bub1 dynamics in response to EGF mirror transcription patterns. (A) HeLa cells were serum starved for 16 h and then stimulated with EGF (20 ng/mL) for the indicated periods. EGR1 pre-mRNA was quantified by qRT-PCR. All values were normalized to GAPDH pre-mRNA in the same sample. Bars indicate averages from duplicate qPCR reactions; error bars, SD. Similar data were obtained in three independent experiments. (B) Treatment as in A, but cells were subjected to ChIP analysis with antibodies against H2Bub1, H3K36me3, and H3K79me2. Immunoprecipitated DNA was quantified by qPCR with primers specific for the 5′-transcribed region of EGR1. Bars indicate ChIP readings normalized to H2B or H3 in the same treatment and represent averages from duplicate qPCR reactions; error bars, SD. Similar results were obtained in three independent experiments. (C) As in A, but JUN pre-mRNA was measured. (D) As in B, but primers specific for the 3′ transcribed region of JUN were used.


