
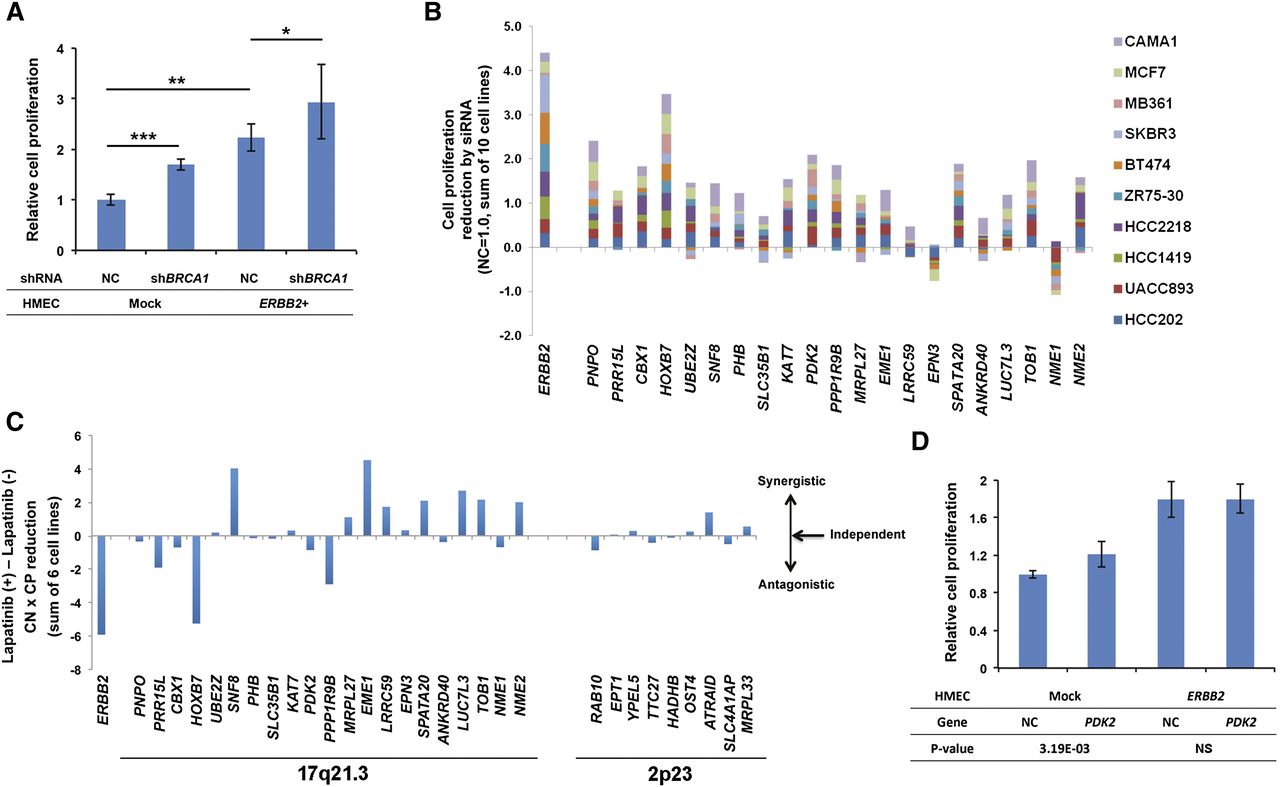
Validation of the cancerous function of genes on Chr 17q. (A) Cell proliferation assay using mock and ERBB2-overexpressing human mammary epithelial cells (HMECs), which were treated with shRNA against BRCA1 or a nontargeting shRNA. Knockdown of BRCA1 increases cell proliferation in both conditions. The average of two independent experiments ± standard deviation is shown. P-values (Student’s t-test): (*) P-value = 3.7 × 10⁻²; (**) P-value = 1.3 × 10⁻⁵; (***) P-value = 3.2 × 10⁻⁶. (B) Cell proliferation assay for 10 breast cancer cell lines transfected with siRNAs against the 17q21.3 genes and ERBB2. Each bar represents the sum of the reductions in cell proliferation caused by each individual siRNA across all cell lines examined. Gene symbols are ordered based on chromosomal location (lower coordinates on left). (C) Combined effect of Lapatinib treatment and cell transfection with siRNAs targeting ERBB2, 17q21.3 genes, or 2p23 control genes in six breast cancer cell lines. The observed reduction in cell proliferation (CP) is multiplied by the copy number (CN) in each cell line (copy number dependency) (Supplemental Fig. 13A,B). Bars correspond to the difference in cell proliferation reduction between cells cultured in the presence and in the absence of Lapatinib. Positive values indicate putative synergistic effects between the Lapatinib and the siRNA treatments, whereas negative values indicate antagonistic effects. Values close to zero represent cases in which the two treatments are independent. A selection of genes mapping to the 2p23 control locus was made to match the range of gene expression levels observed for the 17q21.3 candidate genes across the six experimental cell lines used in this experiment. (D) Cell proliferation assay using mock and ERBB2-overexpressing HMECs, which were transfected with a PDK2-overexpressing vector or a negative control vector (NC), showing enhanced cell proliferation in mock HMECs following PDK2 overexpression (P-value = 3.19 × 10⁻³, Student’s t-test). The average of two independent experiments ± standard deviation is shown. qPCR data showing changes in expression levels following gene silencing/overexpression are shown in Supplemental Figures 10 and 12.


