
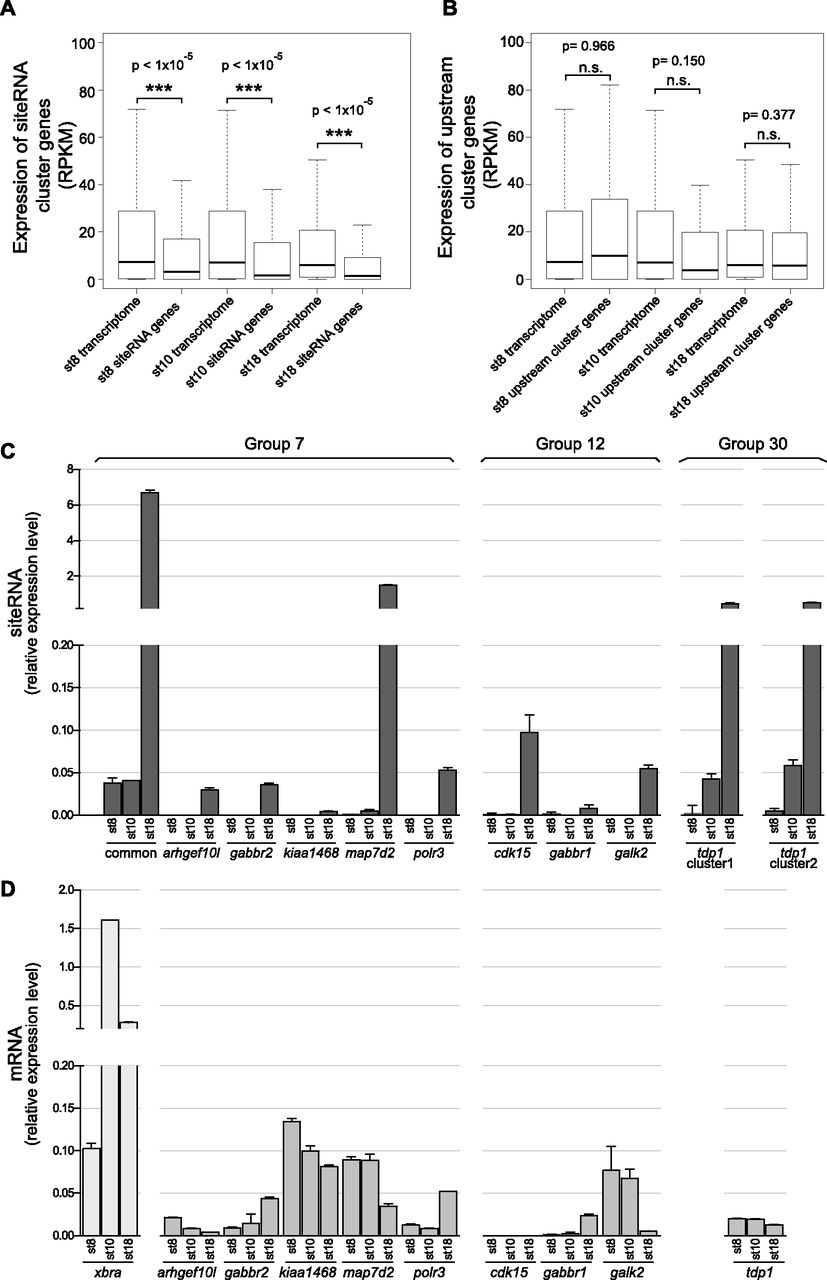
siteRNA clusters are associated with low expression of the gene to which they map. (A) mRNA expression levels obtained by RPKM normalization of mRNA-seq reads for all RefSeq genes (“transcriptome”) and genes containing siteRNA clusters (Supplemental File 2) are compared for stages 8–18. The box and whisker plot displays the median, first, and third quartiles and the whiskers indicate 1.5× the interquartile range. Pairwise Wilcoxon tests were performed to assess changes in the RPKM values between “transcriptome” and siteRNA cluster genes at each stage, and Bonferroni-corrected P-values are indicated. (B) mRNA expression levels for all RefSeq genes (“transcriptome”) and genes containing upstream RNA clusters are compared for stages 8–18 as in A. (C) siteRNA clusters can be amplified using specific qRT-PCR primers at stages 8, 10, and 18 in X. tropicalis embryos. The bars labeled “common” correspond to qRT-PCR using primers that would recognize RNA from all of the group 7 TE remnants. RNA levels relative to odc were calculated and error bars are standard deviations from duplicates. The groups refer to the TE sequence clusters shown in Supplemental Figure S3 and Table 1. (D) mRNA expression levels detected by qPCR at stages 8–18. mRNA levels relative to odc were calculated. Error bars are standard deviations from triplicates. mRNA levels of the developmentally regulated gene xbra are also plotted as a reference.


