
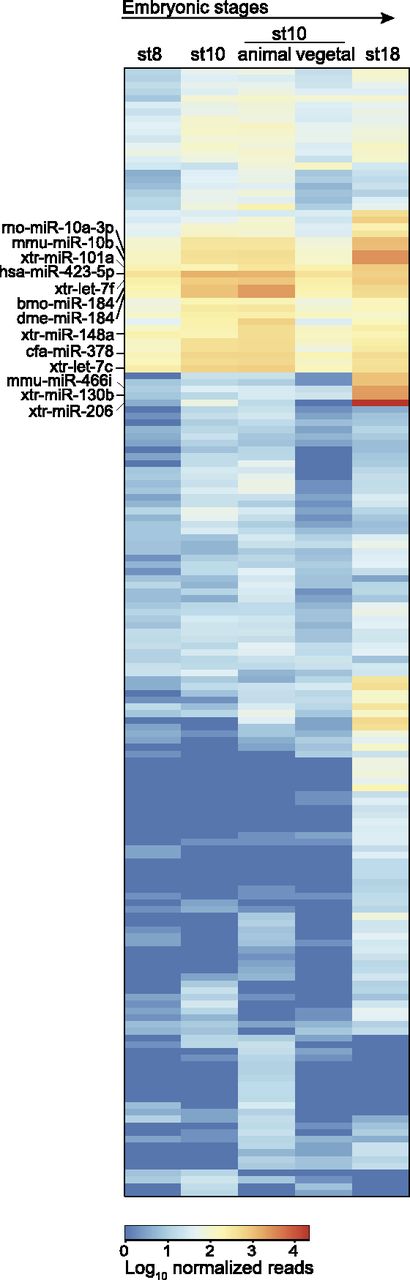
Figure 2.
Heatmap analysis of miRNA expression in early Xenopus development. miRNA tags of 22–23 nt identical in sequence to a miRbase miRNA were clustered by expression similarity. miRNA expression is displayed using a color key where blue corresponds to low and red to high numbers of miRNA normalized reads. The miRNAs labeled are those mentioned in the text and/or the most abundant in the five libraries (Supplemental Table S3).


