
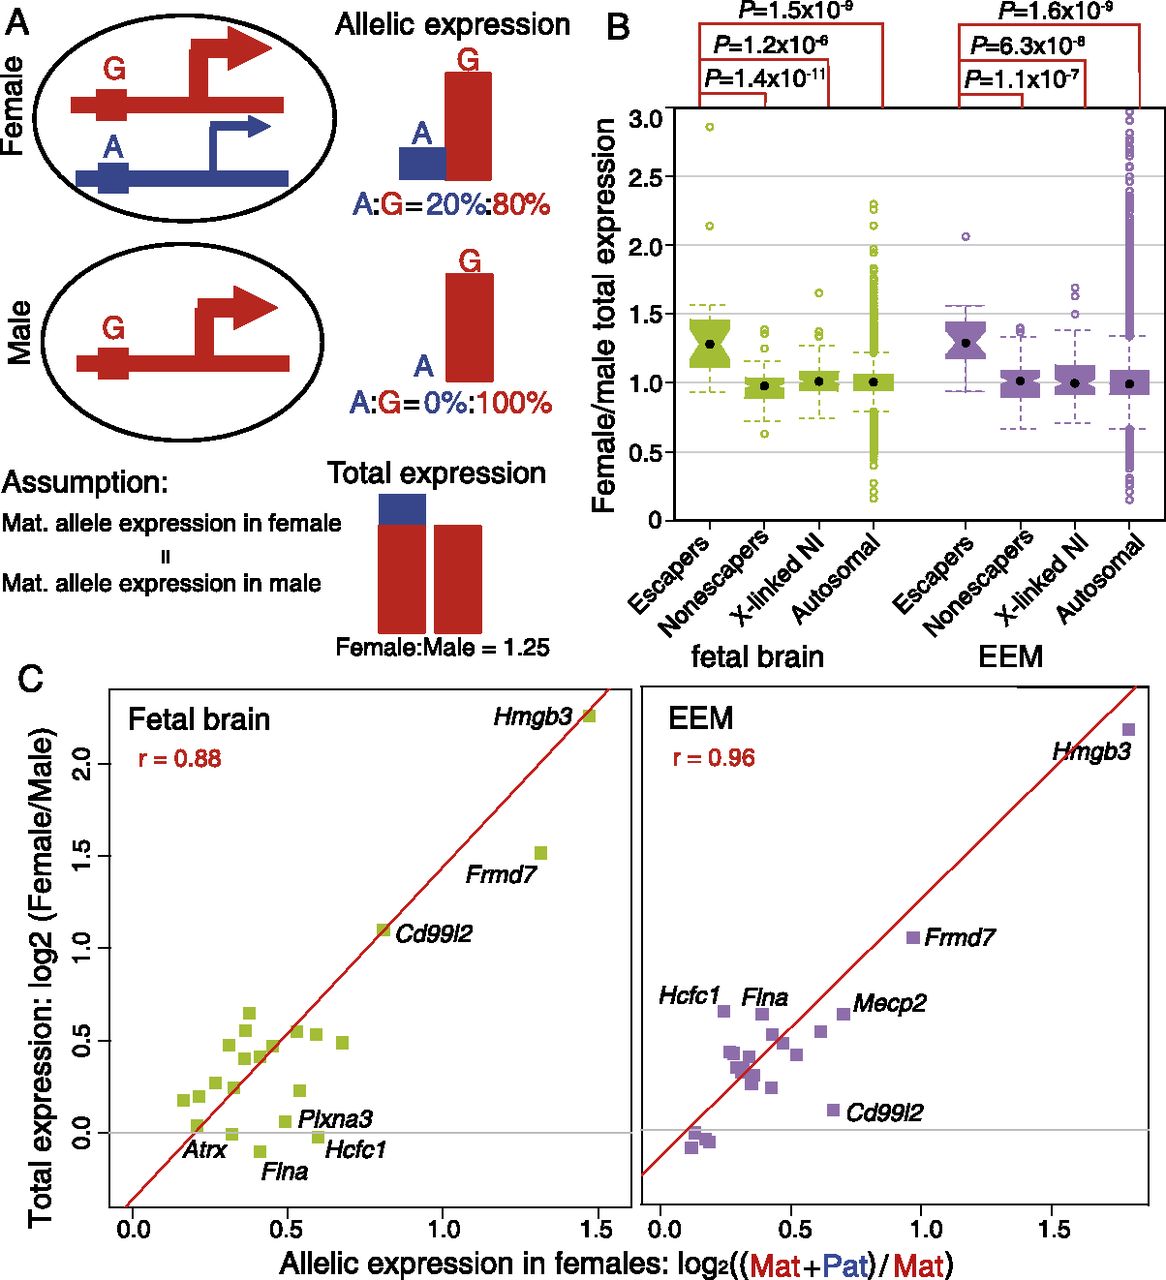
Correlation of paternal escaping percentages in females and female/male (F/M) total expression ratios. (A) Model for a hypothetical escaper gene showing individual allelic and total expression in female and male samples. (Red) The maternally derived (G) allele; (blue) the paternally derived (A) allele. In females (top panel), escaper genes have a fully active maternal allele, and the paternal allele accounts for 20% of the total expression. In males (middle panel), the single (maternal) allele accounts for 100% of expression. Assuming that maternally derived allele expression is the same in females and males, the estimated female/male total expression ratio would be (80% + 20%)/80% = 1.25 (bottom panel). For non-escaper genes, the paternal allele is repressed in females, so the F/M total expression ratio is 1. (B) Boxplot of female/male (F/M) total expression ratios for imprinted X-inactivation escaper genes, non-escaper genes, X-linked genes with no informative SNPs (X-linked NI), and autosomal genes in fetal brain (green) and EEM (purple). The median F/M total expression ratio is 1.3 for escaper genes and 1.0 for the other three groups of genes in both tissues. (C) Scatterplots of allele-specific expression percentages and female/male total expression ratios for escaper genes in fetal brain and EEM with normalized FPKM > 5. The y-axis is the female/male total expression ratio (log2 scale); the x-axis is (maternal + paternal)/maternal allele expression in females (log2 scale). A significant linear relationship is observed for escaper genes in both fetal brain (green squares) and EEM (purple squares) (see text).


