
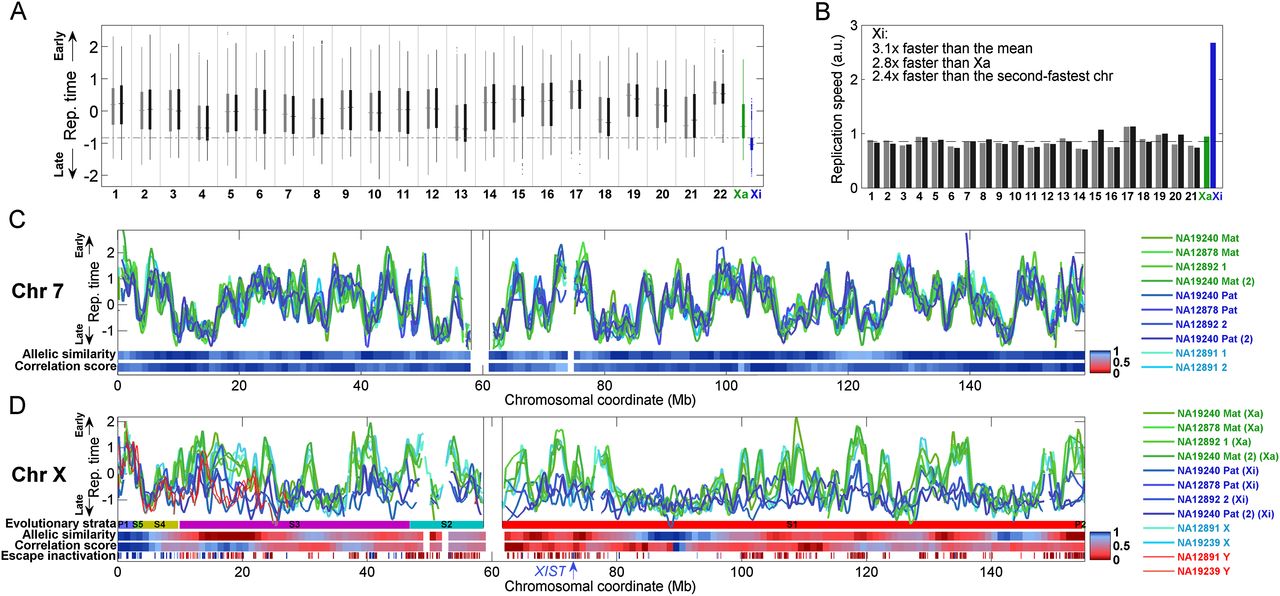
Replication dynamics of the 46 human chromosomes. (A) Distribution of replication timing for each of the 46 chromosomes in lymphoblastoid cell line (LCL) NA19240. For each chromosome, thin vertical lines show the distribution of replication times; thick bars show the 25th and 75th percentiles; and the horizontal line shows the median. (Gray) Maternally inherited chromosomes; (black) paternally inherited chromosomes; (green) the active X chromosome (Xa); (blue) the inactive X chromosome (Xi). Dashed horizontal line is the Xi 25th percentile. The Xi replicated at a time separable from most of the genome. Results for LCLs from the other two females were similar (data not shown). (B) Replication speed (the inverse of the replication time span) of the bulk (interquartile range) of each chromosome in cell line NA19240. The dashed horizontal line represents the autosomal average. Results for LCLs from the other two females were similar (data not shown). Note that the high-GC content chromosome 22 is not shown since its values were unreliable due to relatively poorer data quality. (C) Smoothed chromosome 7 replication profiles of LCLs derived from three females (and one experimental replicate; green and blue) and one male (cyan). The replication profile was similar among individuals and between homologous chromosomes. (Mat) maternal; (Pat) paternal; (1,2) homologous chromosome copies for which parent-of-origin is unknown (Supplemental Fig. S1); [(2)] experimental replicate. Replication time is normalized as a Z-score (Koren et al. 2012). Allelic similarity is the similarity in replication timing between the homologous chromosome copies; correlation score represents the similarity of replication pattern between the homologs (Methods). (Gray vertical lines) Centromere. Results for other autosomes were similar (data not shown). (D) Smoothed replication profiles of chromosome X, showing the delayed, unstructured, and variable replication timing of the Xi relative to the consistent and structured Xa. The X (cyan) and Y (red) chromosomes of two males are shown; the correlation between the two Y chromosomes was r = 0.89. Also shown are the tendency of genes to escape X inactivation, in fractional units, and the X chromosome evolutionary strata. (P) Pseudoautosomal region; (S) stratum. PAR1 and strata 4 and 5 showed the typical autosomal signature of allelic similarity. No other regions on the Xi appeared to have any significant replication structure at the sensitivity level of detection of our method (∼0.5 standard units of replication timing, corresponding to ∼10% of the replication time span—see panel C). XIST replication timing is considered more specifically in Supplemental Figure S3. See Supplemental Figure S2 for more detailed images of X chromosome replication, including replication profiles obtained with higher coverage data for specific regions of the chromosome.


