
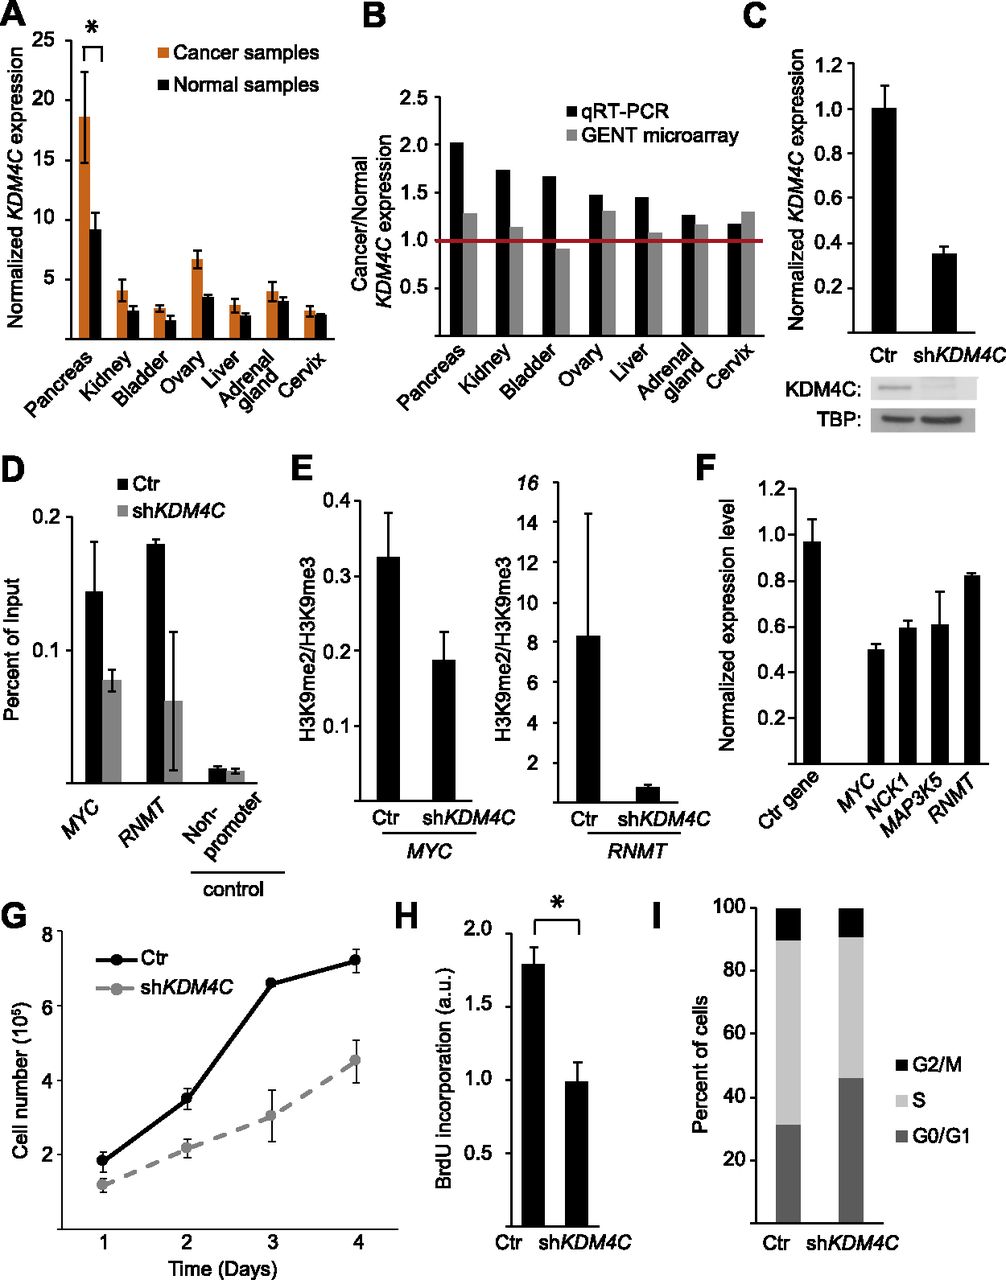
KDM4C expression level in cancer cells. (A) Average KDM4C expression level in cancer tissues relative to matching normal tissues, by qRT-PCR. (B) Ratios of KDM4C expression levels in cancers and the matching controls in seven tissues by our qRT-PCR compared with data from the GENT database of microarray data. (C) KDM4C expression in HT-29 cells expressing shRNA targeting KDM4C or a control shRNA, by qRT-PCR (top) and by Western blot (bottom). (D) ChIP for KDM4C at two target genes, MYC and RNMT, following KDM4C knockdown in HT-29 cells. (E) The ratio of H3K9me2 to H3K9me3 levels at promoters of MYC and RNMT, as determined by ChIP in HT-29 cells following KDM4C knockdown relative to controls. (F) Expression changes in KDM4C target genes following KDM4C knockdown in HT-29 cells (PDIA6 is the control gene). (G) Growth curve analysis (measured in quadruplicate; P = 7 × 10⁻⁸, ANOVA), BrdU incorporation (H; measured in triplicate) and changes in the proportion of cells at different stages of the cell cycle (I) are shown for HT-29 cells with and without KDM4C knockdown. Ctr indicates control cells ([*] P < 0.05, t-test). Error bars, SEM.


