
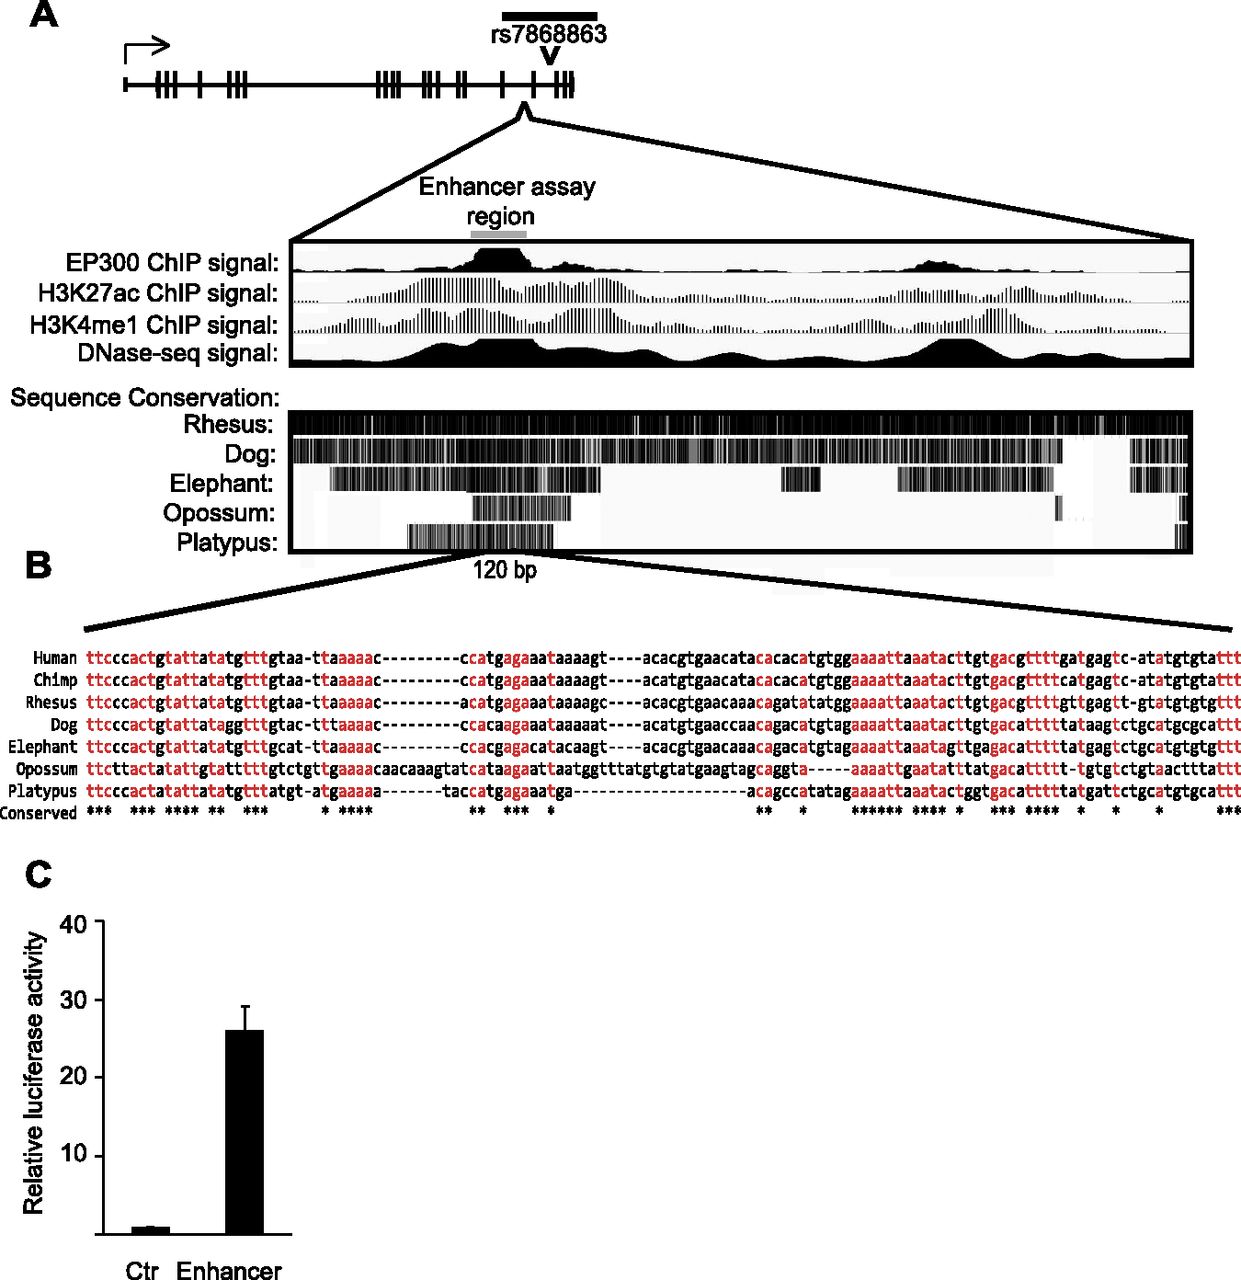
The 3′ regulatory region of KDM4C shows enhancer activity. (A) The black bar above the KDM4C gene schematic represents the region containing SNPs with significant association to KDM4C expression; the position of SNP rs7868863 is marked. (Bottom) The putative enhancer region is indicated; ENCODE data from EBV-transformed B cells of GM12878 show enrichment of EP300, H3K27 acetylation, H3K4 monomethylation, and DNase I hypersensitivity. Sequence conservation, from the UCSC Vertebrate Multiz Alignment tract, is also displayed. The gray bar shows the location of the 290-bp fragment used in the luciferase reporter assay. (B) Sequence alignment is shown for a 120-bp DNA segment of the region used in the luciferase reporter assay. Sequences that are identical across the represented species are shown in red and are marked by a star below the alignment. (C) Relative luciferase activity in primary fibroblasts transfected with the reporter containing the putative enhancer region compared with control. Assays were performed in primary fibroblasts from three individuals, in duplicate. Error bars, SEM.


