
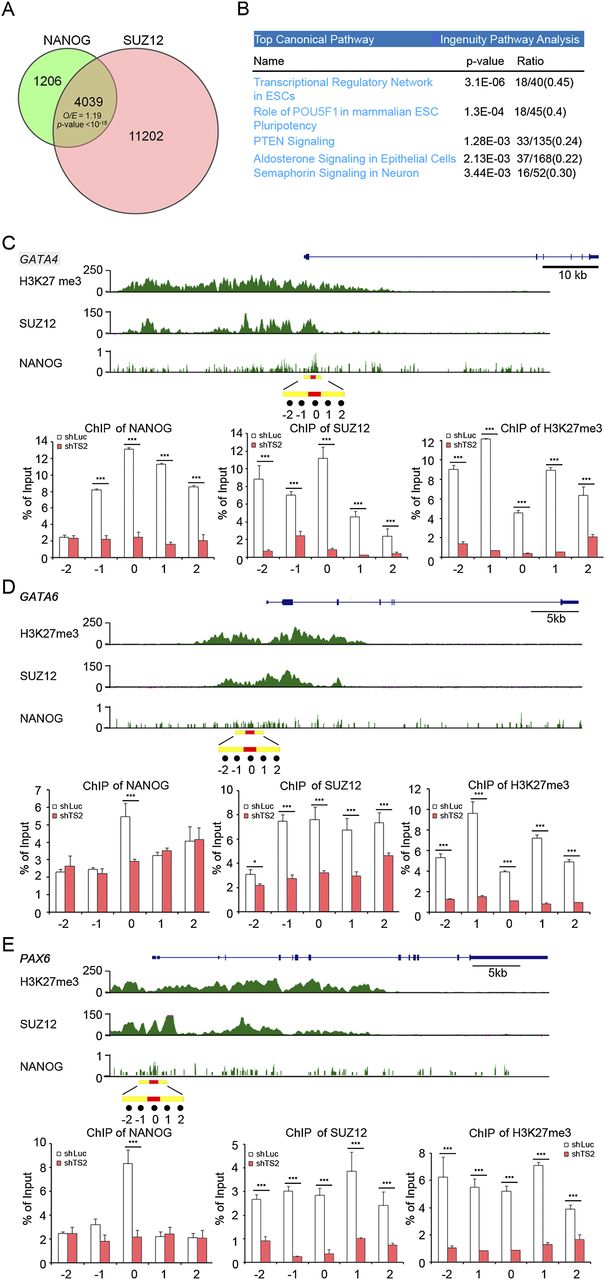
Knockdown of tsRMST in hESCs decreased the H3K27me modification on the promoters of NANOG and SUZ12 occupied genes. (A) Venn diagram and the observed-to-expected (O/E) ratio of genes bound by both NANOG and SUZ12. The total number of analyzed genes was 23,671. P-value was estimated by the χ2 test. The ChIP-seq data of NANOG and SUZ12 were generated by the ENCODE project (The ENCODE Project Consortium 2012) and downloaded from the UCSC Genome Browser at http://genome.ucsc.edu/. A NANOG-/SUZ12-occupied gene was defined by the binding of NANOG/SUZ12 to its promoter region, centered within 2000 bp of the transcription start site. (B) Top five canonical pathways for the genes bound by both NANOG and SUZ12, as determined by Ingenuity Pathway Analysis (IPA) (Supplemental Table 1). The ratios represent the number of genes bound by both NANOG and SUZ12 divided by the total number of genes within the corresponding pathway. (C–E) ChIP-qPCR analysis of the H3K27me3 modification and the occupancy of NANOG and SUZ12 on the promoters of three lineage-specific genes repressed by tsRMST. (C) GATA4 (chr8:11565365−11617509); (D) GATA6 (chr18:19749416−19782227); and (E) PAX6 (chr11:31806340−31832879). ENCODE ChIP-seq data of NANOG and SUZ12 occupancy and the H3K27me3 modification were aligned to the promoter regions of the lineage-specific genes, as indicated. The promoter regions were defined as −2 kb to +2 kb of the transcription start sites. For each figure, the y-axis of the upper panel represents the intensity of ChIP-seq reads. The highest NANOG binding peaks on the promoter regions of GATA4, GATA6, and PAX6 were highlighted with red bars (chr8:11567094–11567723 for GATA4, chr18:19747482–19747800 for GATA6, and chr11:31832538–31832842 for PAX6). ChIP fragments containing the selected NANOG binding peak (labeled as 0) or its four flanking regions (labeled as −1, −2, 1, and 2, which were located within −1 kb to +1 kb of the selected NANOG binding peak [highlighted with yellow bars]) in shLuc and shTS2 transduced hESCs were quantified by qPCR, and respectively normalized with the input genome used in ChIP. The same process was applied to SUZ12 and H3K27me3. The primers are listed in Supplemental Table 6.


