
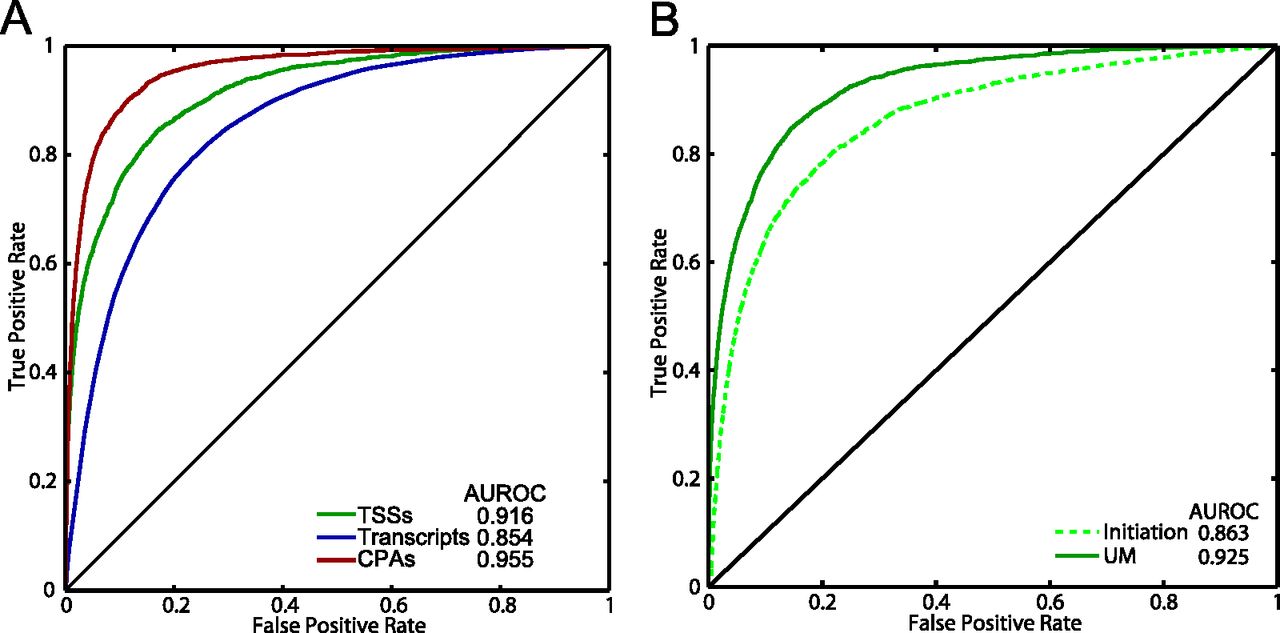
Figure 5.
Performance of the UM. (A) ROC curves illustrating how well the UM predicts TSSs, transcripts, and CPA sites, when classifying the positive and negative examples for the initiation and termination classifiers, as well as ORFs/transcripts and nontranscript bases. (B) ROC curve comparing the ability of both the UM and initiation classifier to distinguish between TSSs and bases that are part of nondubious ORFs. The line y = x represents the curve expected by random classification.


