
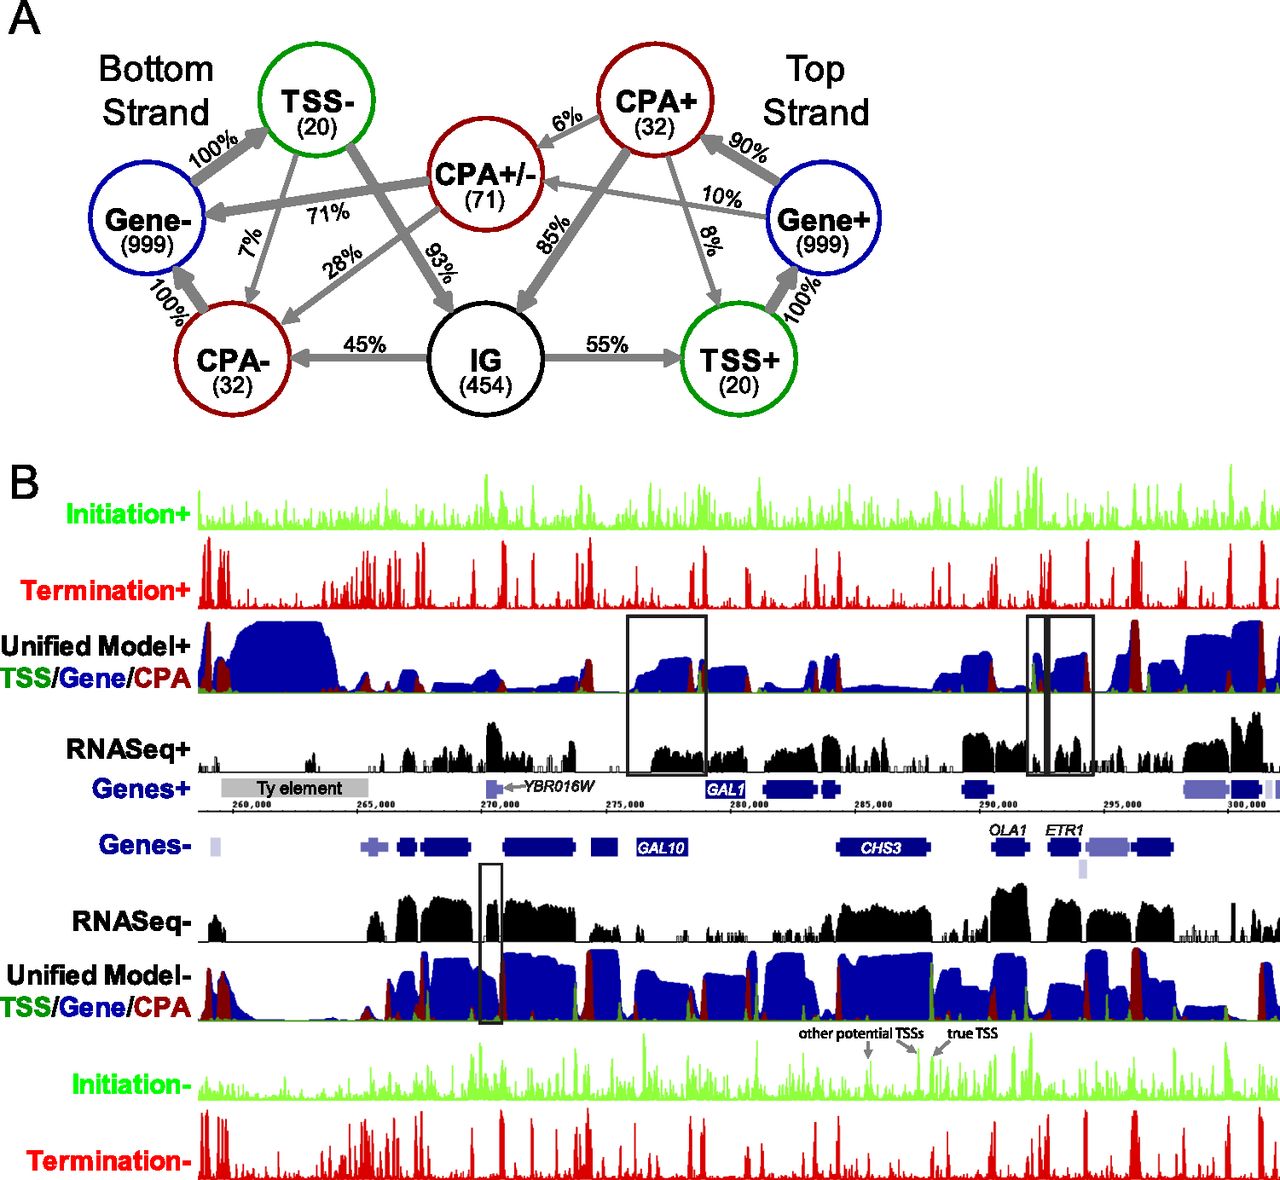
A genome-scale yeast transcript model. (A) The structure of the Unified Model HMM. Circles represent states and arrows represent interstate transitions. Inside state circles, the number of bases the model expects to remain in each state is shown in parentheses. Transition probabilities, as a percent of outgoing transitions, are shown on transition arrows. Very infrequent transitions (probability < 1%) are not shown. (IG) Intergenic state. (B) Genome Browser display illustrating the predictions of the models at the GAL1-10 locus of chromosome 2. The tracks on the top half represent data for the forward strand of DNA, with the reverse strand on the lower half. From center: blue bars represent genes, with thinner bars representing UTRs, and the gray bar represents a Ty element. Black tracks represent RNA-seq read density on a log scale (Levin et al. 2010). The Unified Model's predictions are shown with dark green, blue, and red on a single track representing the probability of being in each of the states, where the probabilities are shown stacked. The light green and red tracks on the outer edge represent the scores for the initiation and termination classifiers, respectively. Initiation peaks corresponding to the true TSS and other potential TSSs for the CHS3 gene are as indicated, and some examples of predicted nongenic transcripts that are supported by RNA-seq are shown boxed.


