
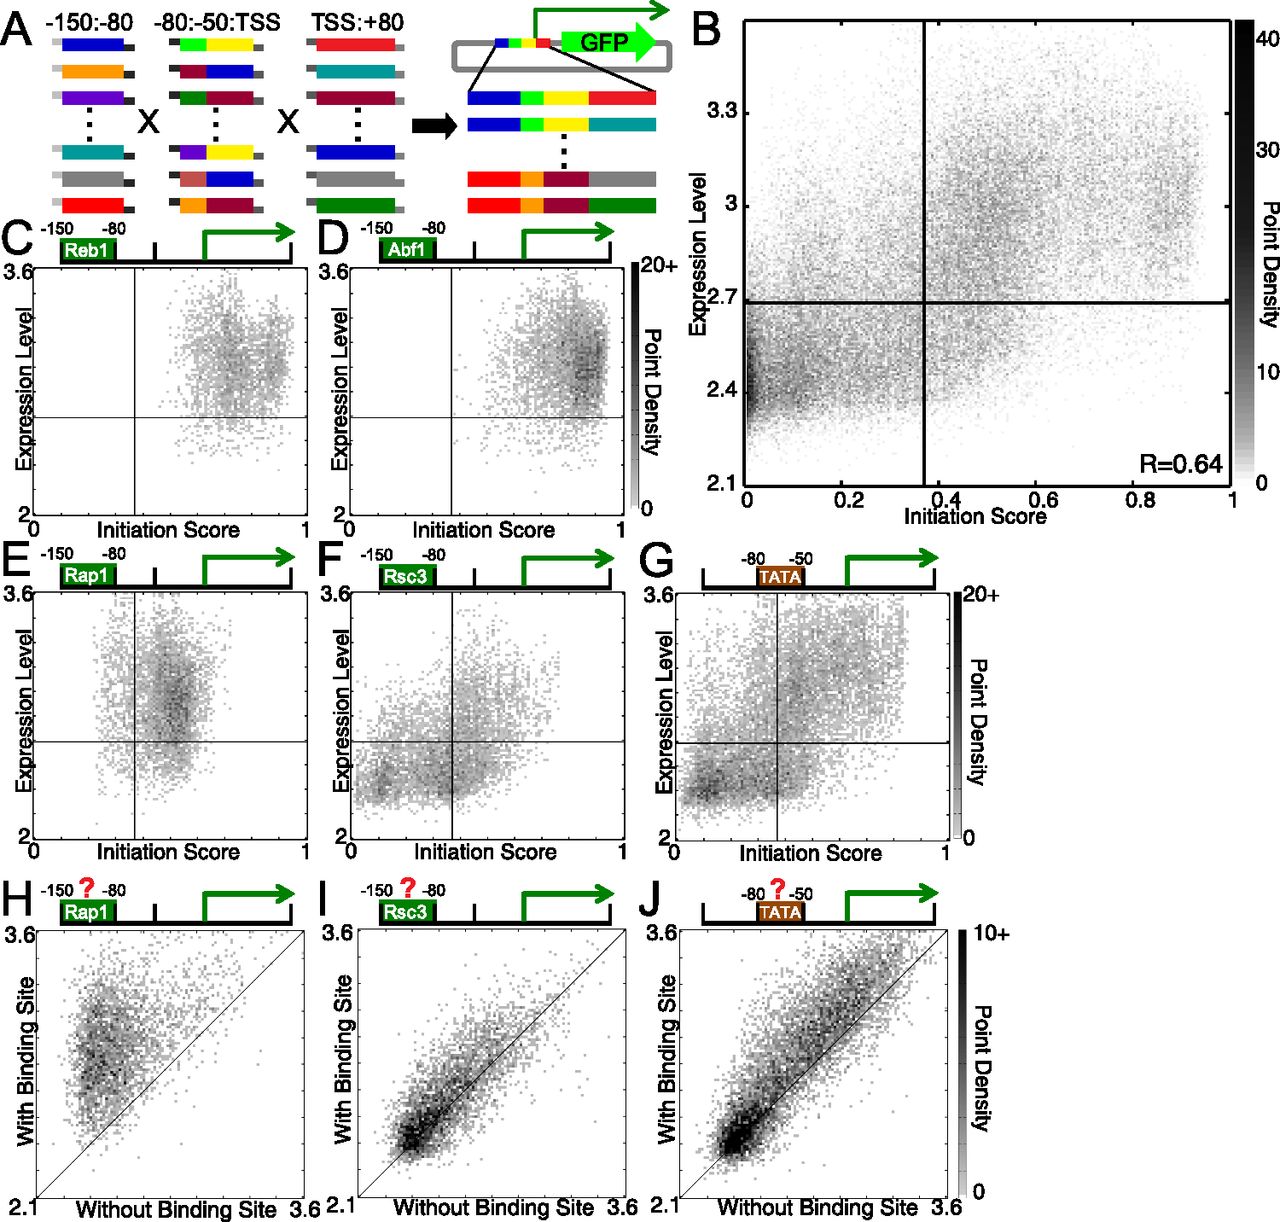
Construction and analysis of the combinatorial promoter library. (A) Synthetic double-stranded promoter fragments with complementary overhangs were ligated together to yield full-length promoters, which were then cloned into a GFP expression vector. We used flow cytometry and sequencing to measure the expression level of each promoter (see Methods). (B) Point-density scatter plot showing the correlation between the initiation score and the expression level (as described in Methods, log-scale). Darkness corresponds to point density. Horizontal and vertical lines indicate the expression level and initiation score thresholds for considering sequences “expressed” and a “predicted promoter,” respectively. (C–G) Identical to B but divided into promoters containing (C) Reb1, (D) Abf1, (E) Rap1, and (F) Rsc3 binding sites in the −150:−80 bin, and (G) the TATA box in the −80:−50 bin. (H–J) Point-density scatter plots showing the expression level of promoters that are identical except for the presence or absence of functional (H) Rap1, (I) Rsc3, or (J) Spt15 (TBP) binding sites. The line y = x marks the point at which expression is identical between the two promoters, regardless of the binding site's presence. The other GRFs (Abf1 and Reb1) are similar to Rap1 (H).


