
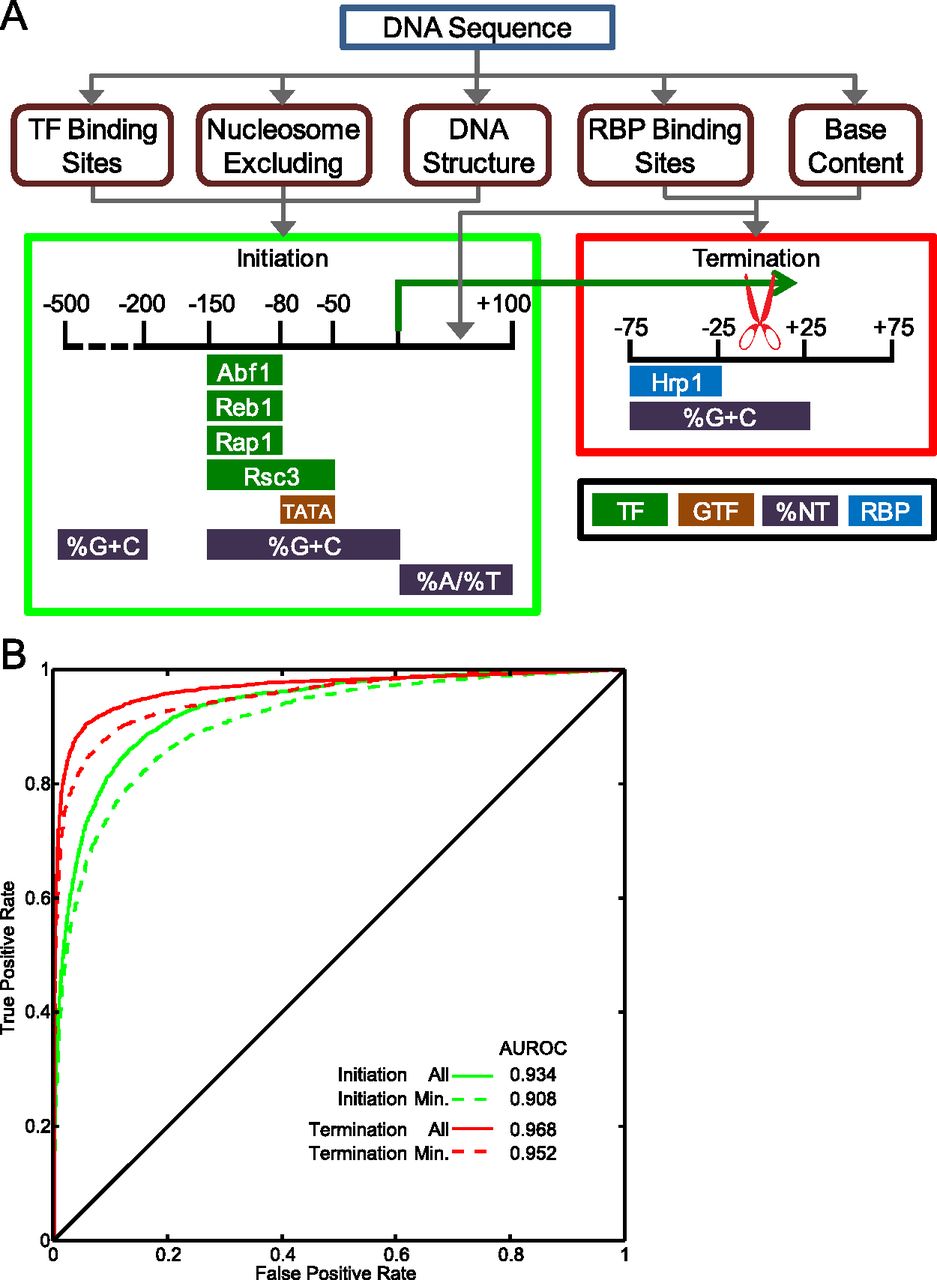
Design, refinement, and performance of the classifiers. (A) Classifier pipeline. Training and test examples were generated by calculating the relevant features (rounded boxes) using the DNA sequence of the example. The features were calculated over the bins shown in the colored boxes. At the bottom of the colored boxes, the components of the minimal feature sets are shown. Feature colors represent the feature type, including transcription factors (TF), general transcription factors (GTF), base content (%NT), or RNA-binding proteins (RBP). (B) ROC curves representing initiation and termination classifiers with either all features tested or the minimal feature sets, derived from the test data. The line y = x represents the curve expected by random classification.


