
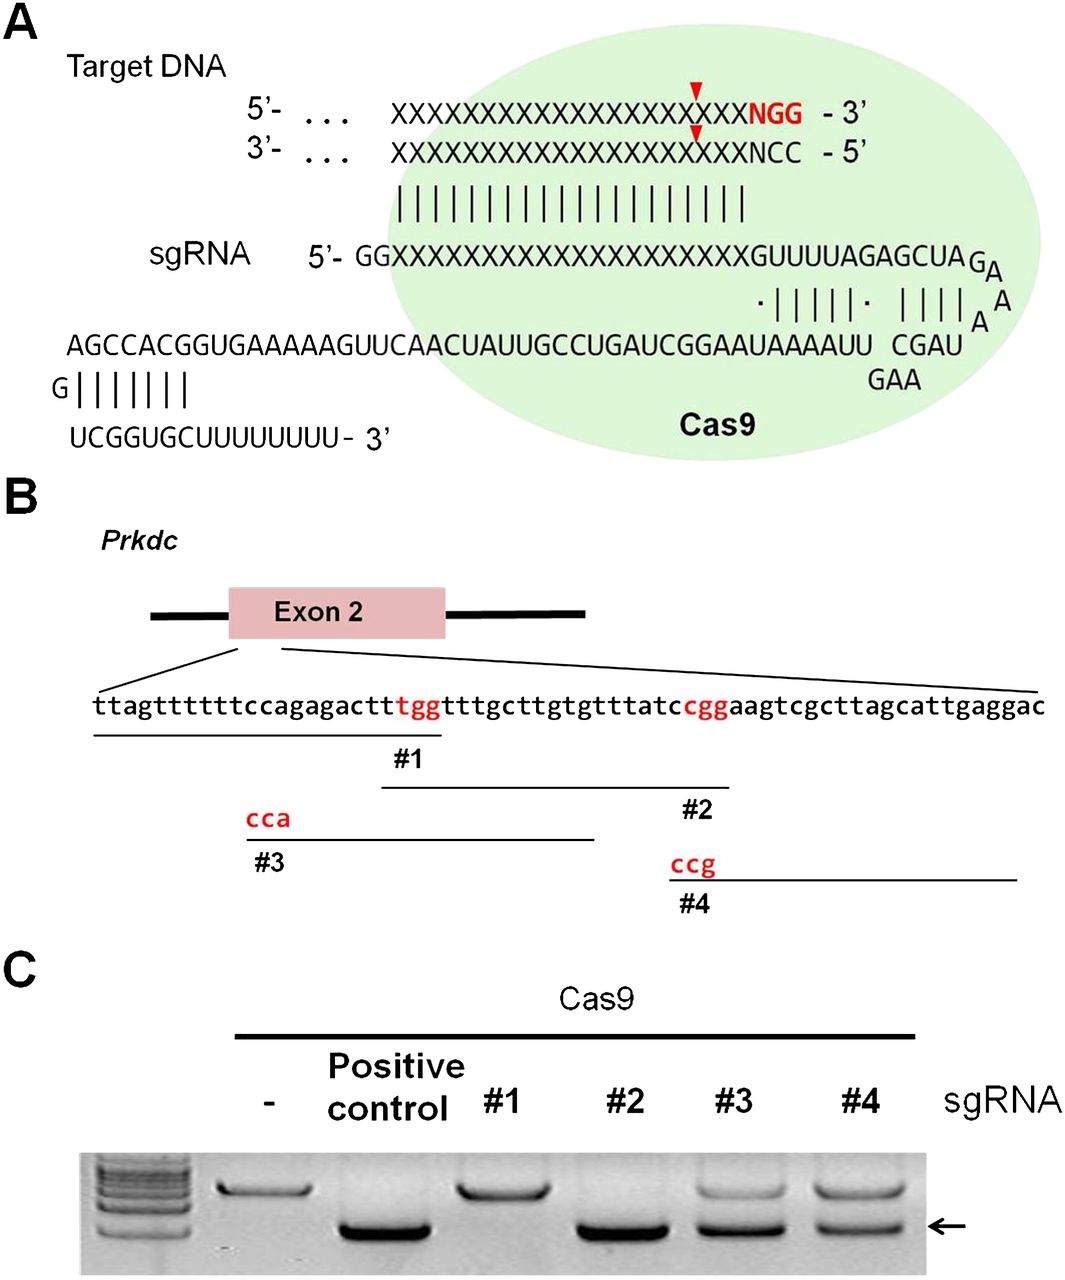
Figure 1.
Generation of a RGEN specific for the Prkdc gene. (A) A schematic diagram depicting a target-specific single guide RNA (sgRNA). (B) RGEN target sites in exon 2 of the mouse Prkdc gene. PAMs are shown in red and targets are denoted by black lines. (C) In vitro cleavage assays evaluating Prkdc-RGEN activity. The arrow indicates bands cleaved by RGENs.


