
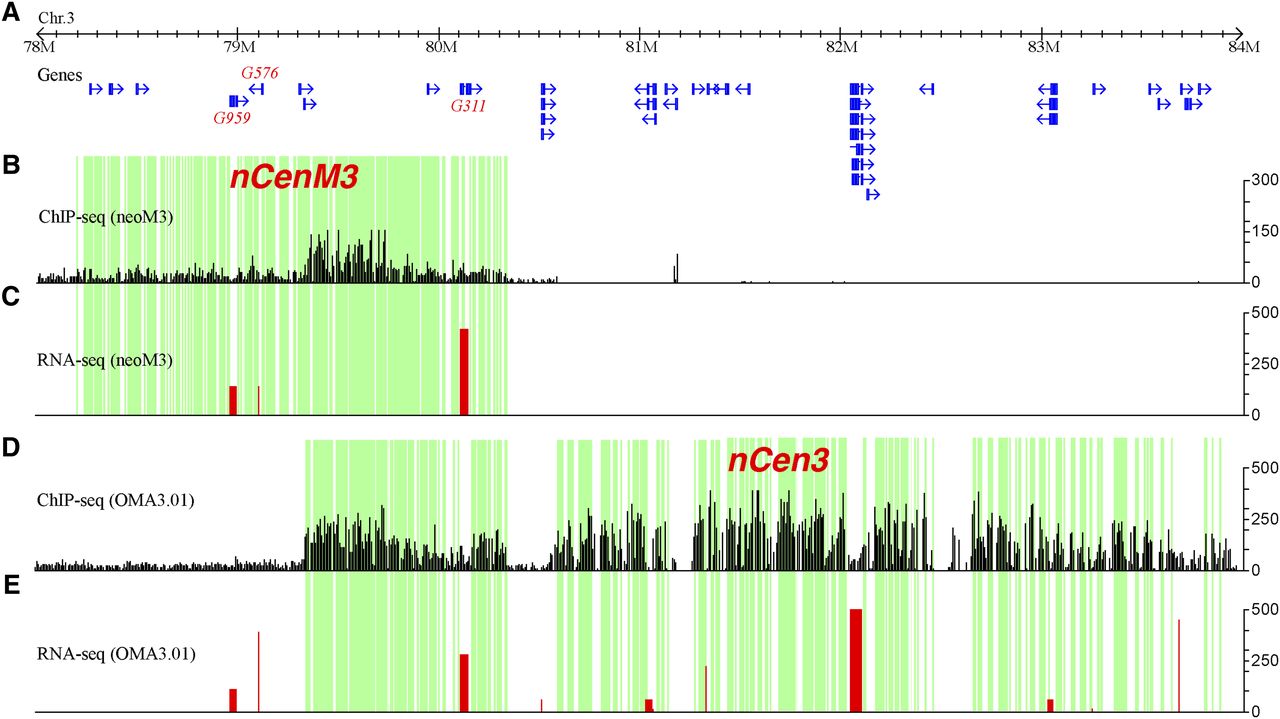
Mapping of CENH3 binding and gene expression in the neocentromeres. (A) The positions of non-TE genes annotated in nCenM3 and nCen3, which overlap in the 79.3–80.3 Mb region. (B) Distribution of ChIP-seq reads in nCenM3. Each black bar represents the number of ChIP-seq reads (y-axis) in a 1-kb window. (C) Gene expression value (FPKM, y-axis) based on RNA-seq in the neoM3 line. (D) Distribution of ChIP-seq reads in nCen3. Each black bar represents the number of ChIP-seq reads (y-axis) in a 1-kb window. (E) Gene expression value (FPKM, y-axis) based on RNA-seq in the OMA3.01 line. The green blocks indicate subdomains significantly enriched with CENH3, which are interspersed with subdomains that were not enriched with CENH3 (blocks with no color).


