
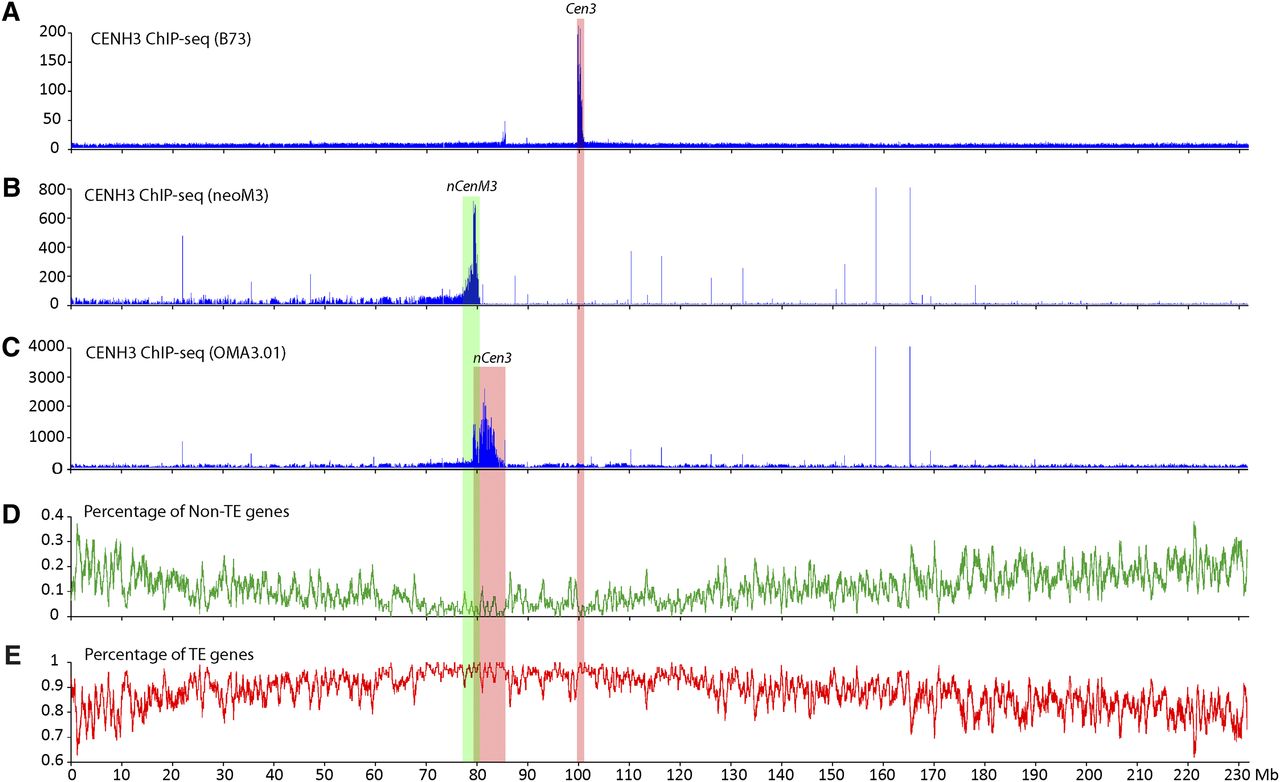
Mapping of the centromere and neocentromeres on maize chromosome 3. (A) Mapping of ChIP-seq reads from B73 on maize chromosome 3. The CENH3-binding domain of Cen3, marked by a pink box, was mapped to the region between 99.78 and 100.76 Mb. The y-axis shows the number of ChIP-seq reads in 10-kb windows along chromosome 3. (B) Mapping of ChIP-seq reads from the neoM3 line on maize chromosome 3. The CENH3-binding domain of nCenM3, marked by a green box, was mapped to the region between 78.2 and 80.3 Mb. Background reads were detected throughout 0 to 80.6 Mb. The y-axis shows the number of ChIP-seq reads in 10-kb windows along chromosome 3. Chromosome 3 sequence of maize B73 is used as the reference sequence. (C) Mapping of ChIP-seq reads from the OMA3.01 line on maize chromosome 3. The CENH3-binding domain of nCen3, marked by a pink box, was mapped in 79.3–83.9 Mb. The y-axis shows the number of ChIP-seq reads in 10-kb windows along chromosome 3. (D) Distribution of non-TE genes on maize chromosome 3. The y-axis shows the percentage of non-TE genes in 10-kb windows. (E) Distribution of TE-related genes on maize chromosome 3. The y-axis shows the percentage of TE-related genes in 10-kb windows. The vertical pink and green boxes across all panels indicate the positions of the neocentromere and original centromere on maize chromosome 3.


