
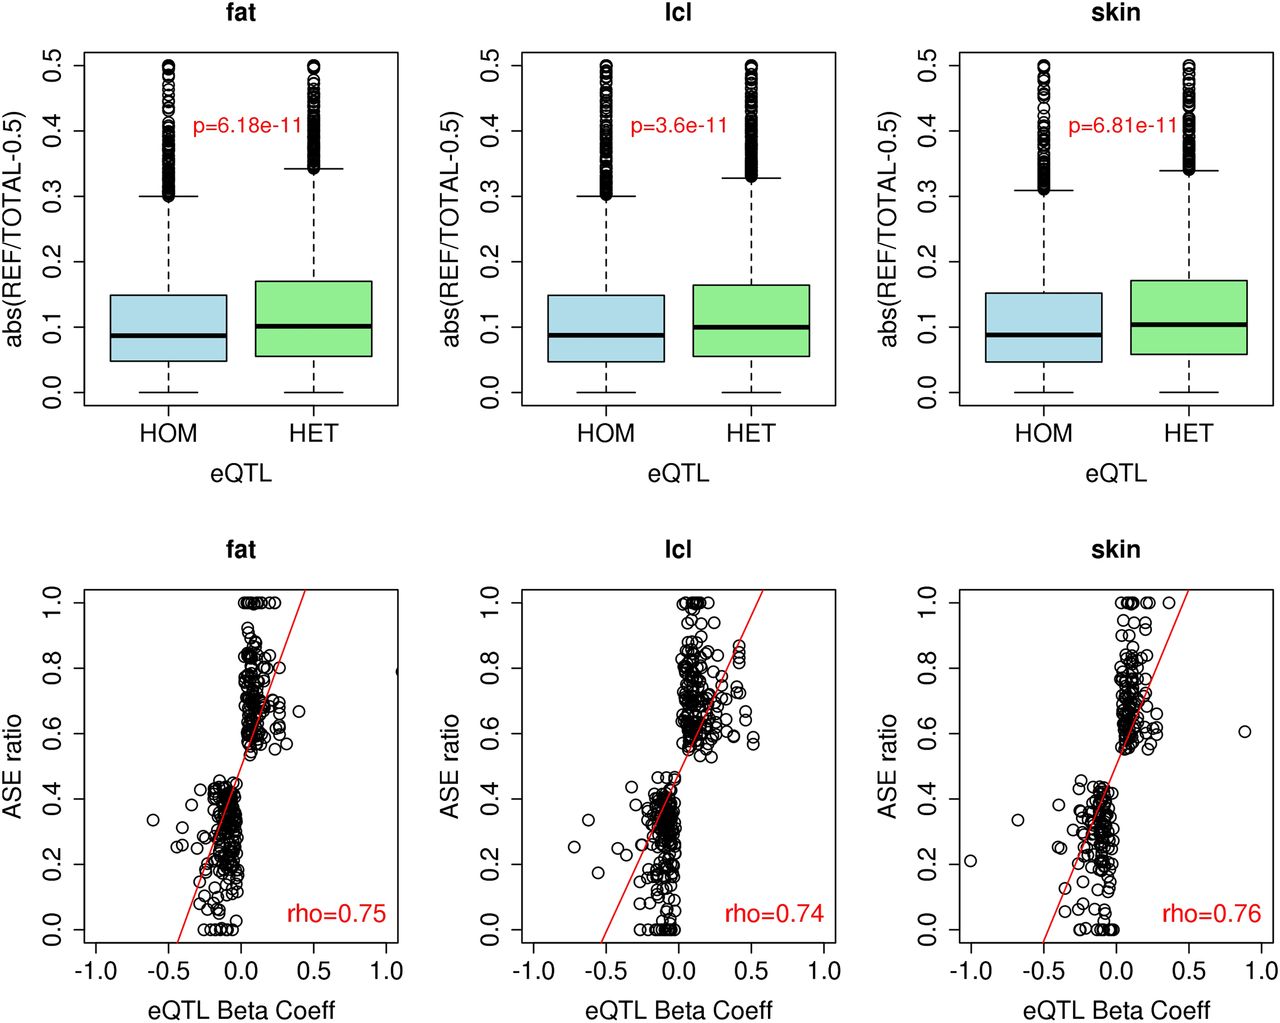
Figure 4.
Candidate beta cell cis eQTLs discovered initially in other tissues (fat, LCL, skin). Top panel boxplots show the deviations of allelic ratios (reference/total) from the expected 0.5 in ASE individuals grouped by eQTL genotype, with heterozygotes having markedly higher effects on ASE ratios compared to homozygotes. Bottom scatterplots show the beta coefficients of the MuTHER eQTLs and the corresponding beta ASE ratios for the selected candidate beta cell regulatory variants.


