
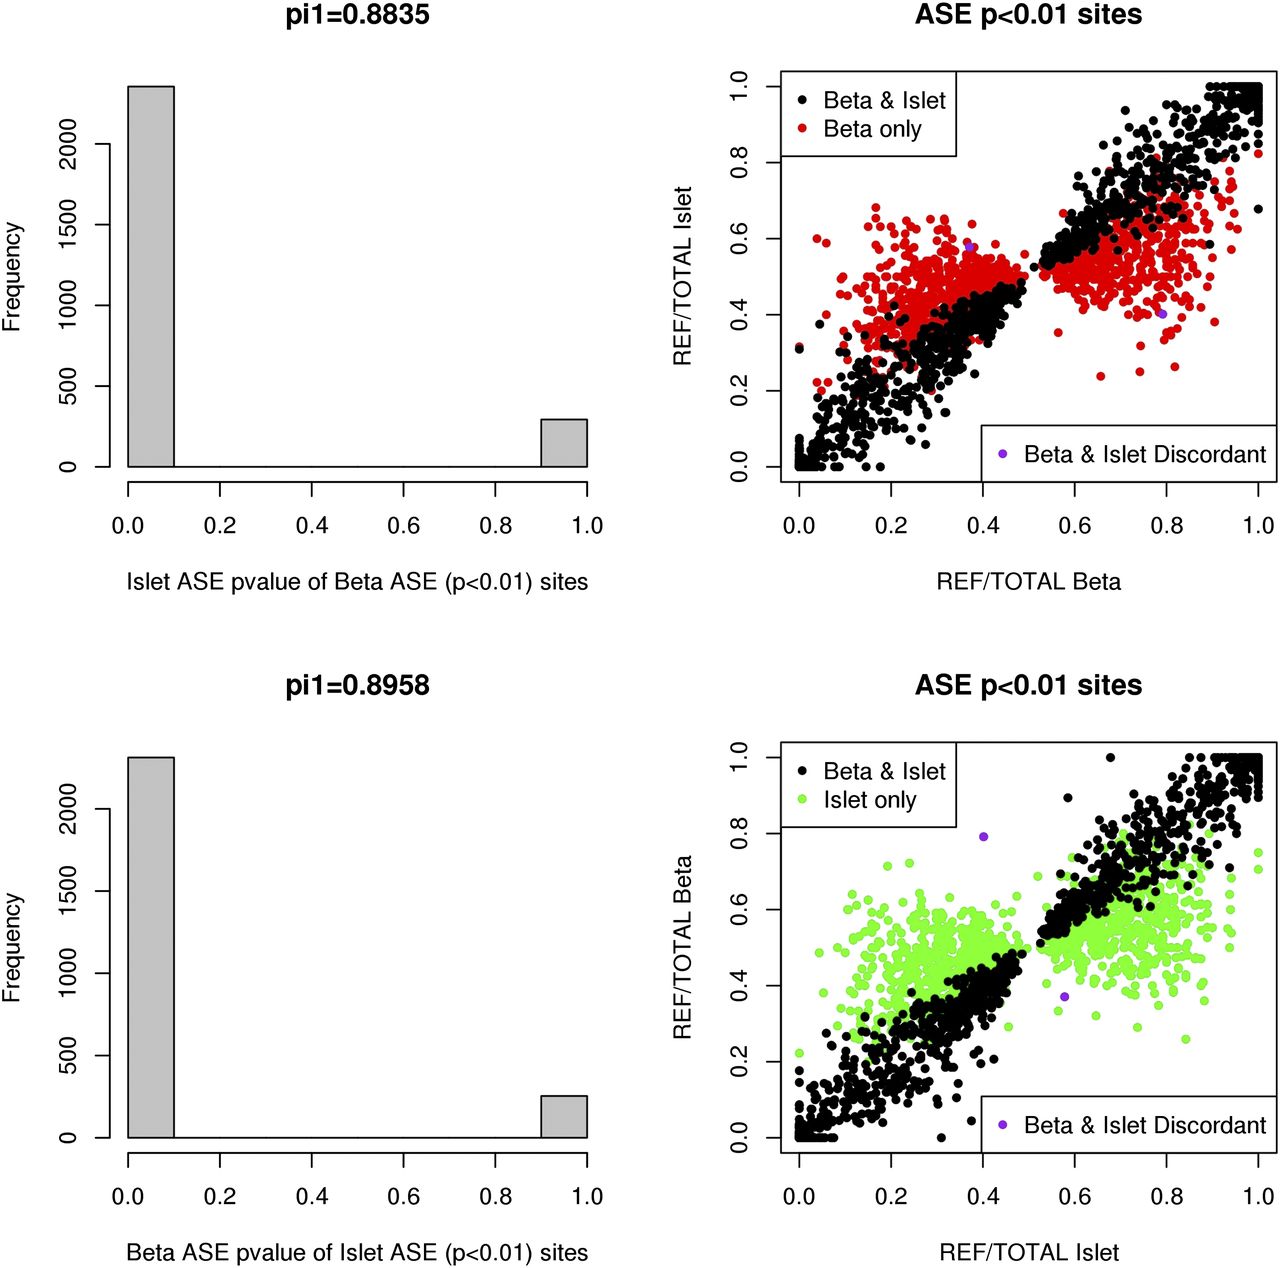
Figure 3.
Sharing of significant ASE effects between beta cells and islets (sample P775). Left panel histograms show the enrichment (pi1) of significant ASE P-values in the islets for ASE sites discovered in beta cells and vice versa (beta cell ASE P-values of ASE sites discovered in islets). Right panel scatterplots display the direction of ASE effects (ratio of reference allele count to the total number of reads covering that site) between the two cell types, almost always in concordance.


