
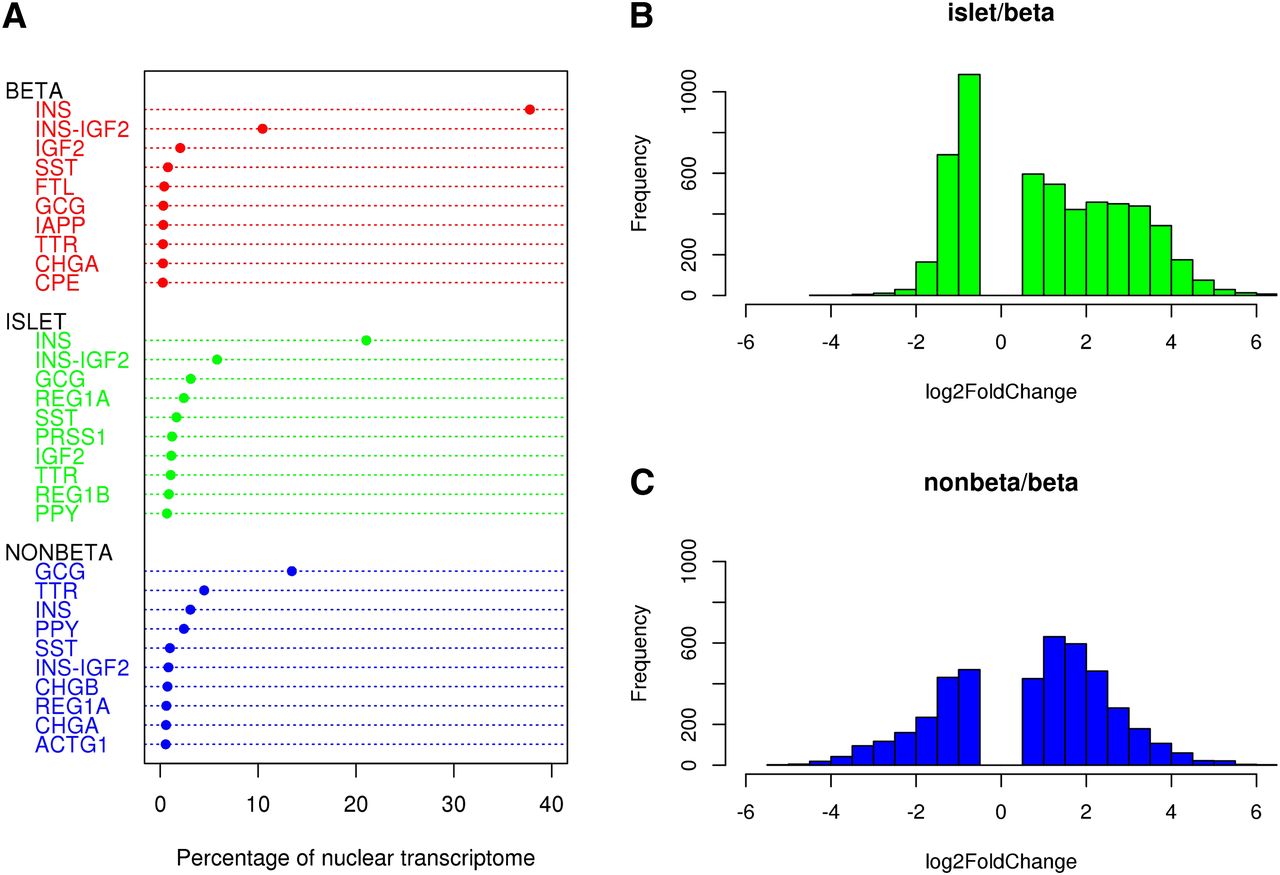
Figure 2.
Expression differences between beta, islet, and nonbeta samples. (A) Dot chart of top 10 highest expressed genes and their contribution to the nuclear transcriptome by cell type. (B) Histogram of log2 Fold Change (islet/beta) for differentially expressed genes (10% FDR) in islets and beta cells. (C) Histogram of log2 Fold Change (nonbeta/beta) for differentially expressed genes (10% FDR) in nonbeta and beta cells.


