
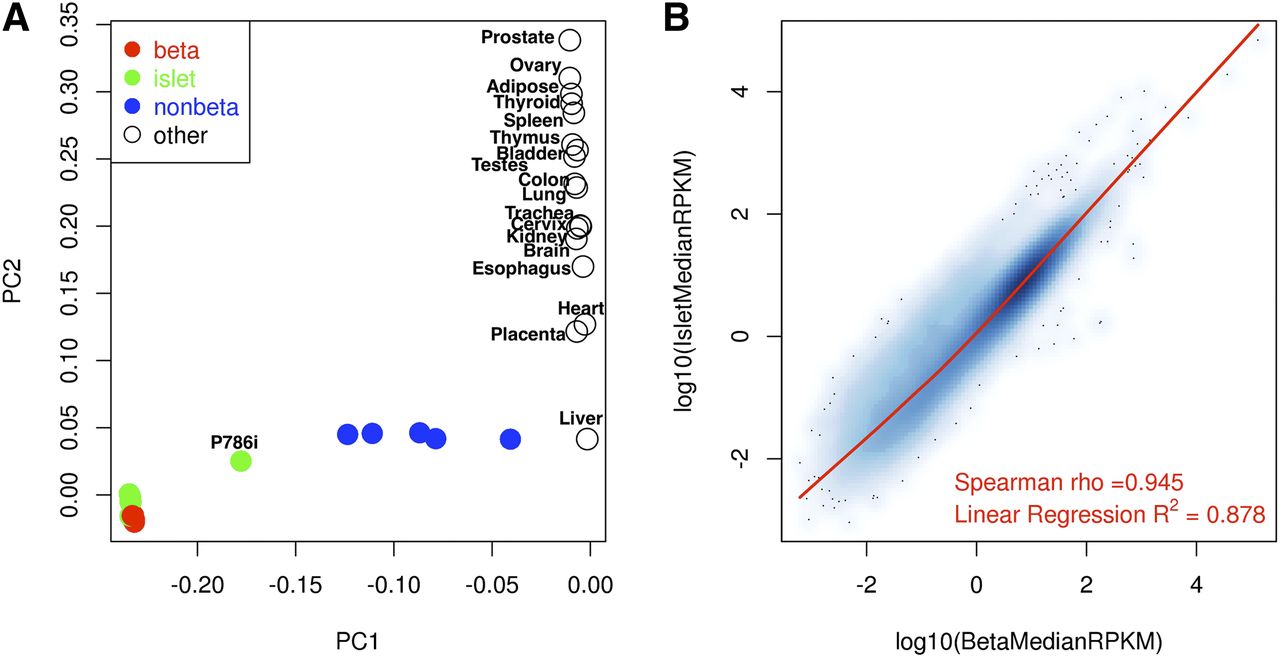
Figure 1.
High overall similarity between beta cell and islet gene expression. (A) PCA analysis of gene RPKMs for beta (N = 11), islet (N = 7), nonbeta (N = 5) preparations, and 18 other tissues from unrelated individuals. Beta cell and islet samples cluster together, separating from nonbetas. The other tissues cluster separately, with liver being the most similar to the islet-derived RNA-seq data. (B) Scatterplot of beta cell versus islet median RPKMs on log10 scale.


