
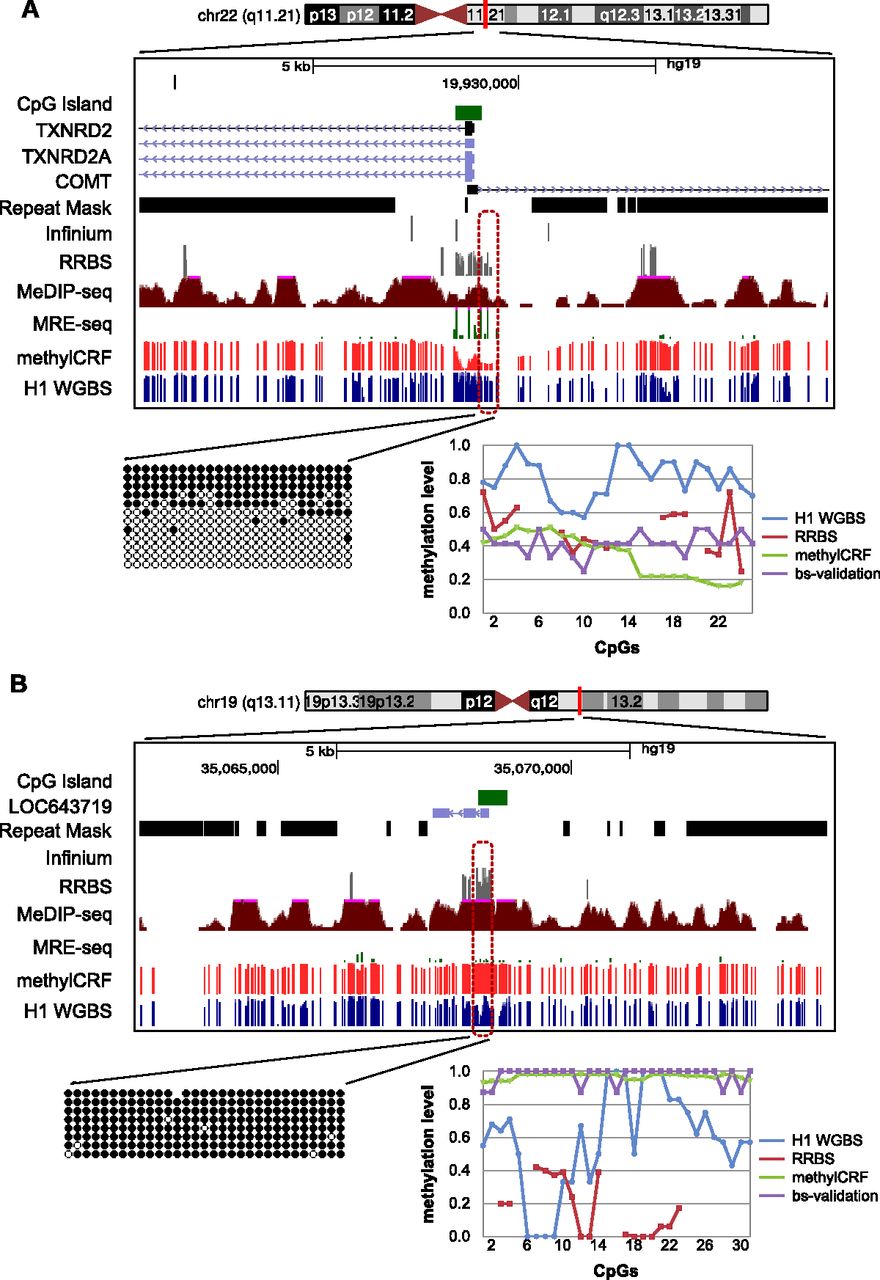
Experimental validation of regions where there is discordance between MethylC-seq and methylCRF. Genome Browser view and site-specific bisulfite sequencing validation for each region (○ unmethylated CpG; • methylated CpG). The line graph shows the methylation levels estimated by MethylC-seq, RRBS, bisulfite validation, and methylCRF. (A) chr22: 19929336–19929659; MethylC-seq predicted on average a methylation level of 80% methylated, while methylCRF and bisulfite validation agreed on a level of 40% methylated. (B) chr19: 35068305–35068683; MethylC-seq predicted on average a methylation level of 60% methylated, while methylCRF and bisulfite validation agreed that the region is more than 90% to completely methylated.


