
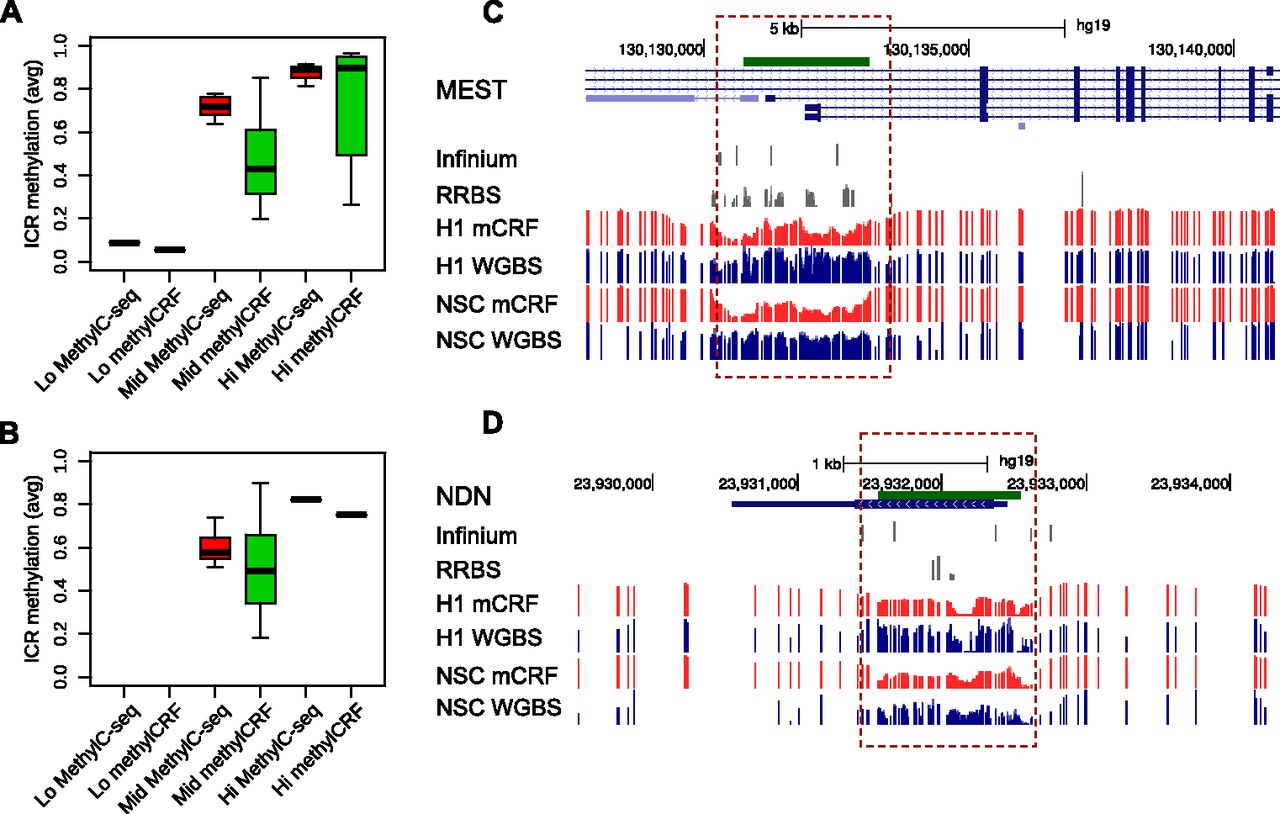
Figure 8.
Comparing methylCRF and WGBS predictions in imprinted control regions. (A) Known imprinted control regions (ICRs; https://atlas.genetics.kcl.ac.uk) (Supplemental Table 2) were grouped based on WGBS data (H1 ESC, MethylC-seq), as “Lo” (average methylation ≤0.2), “Mid” (average methylation between 0.2 and 0.8), and “Hi” (average methylation ≥0.8). Boxplots represent average methylation levels of these ICRs based on MethylC-seq and methylCRF. (B) Same as A, except for fetal NSCs. (C) A Genome Browser view of ICR near gene MEST (mesoderm specific transcript, chr7). (D) A Genome Browser view of ICR near gene NDN (necdin, chr15).


