
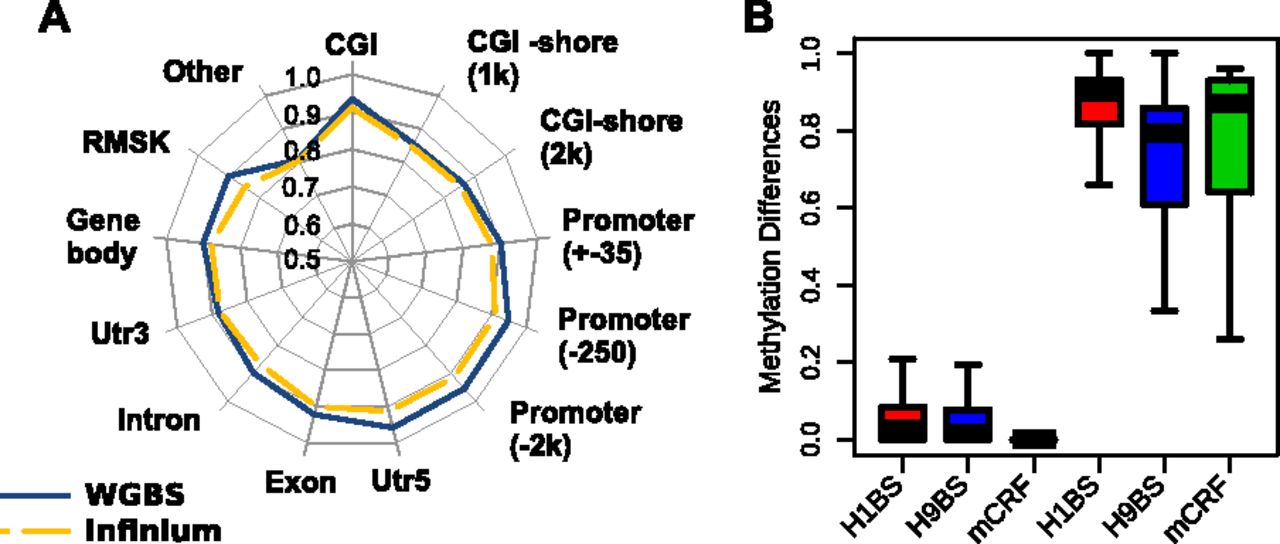
Figure 7.
Applying methylCRF to fetal NSCs. (A) Concordances between methylCRF and WGBS data and between methylCRF and Infinium array broken out by annotated genomic features. (B) CpG islands were grouped as “indifferent” and “different” based on their methylation levels in H1 ESC and fetal NSC (Hu-F-NSC-02) assessed by WGBS data. Actual difference distributions were plotted between H1 ESC (WGBS, red), or H9 ESC (WGBS, blue), or H1 ESC (methylCRF, green) and fetal NSCs (WGBS).


