
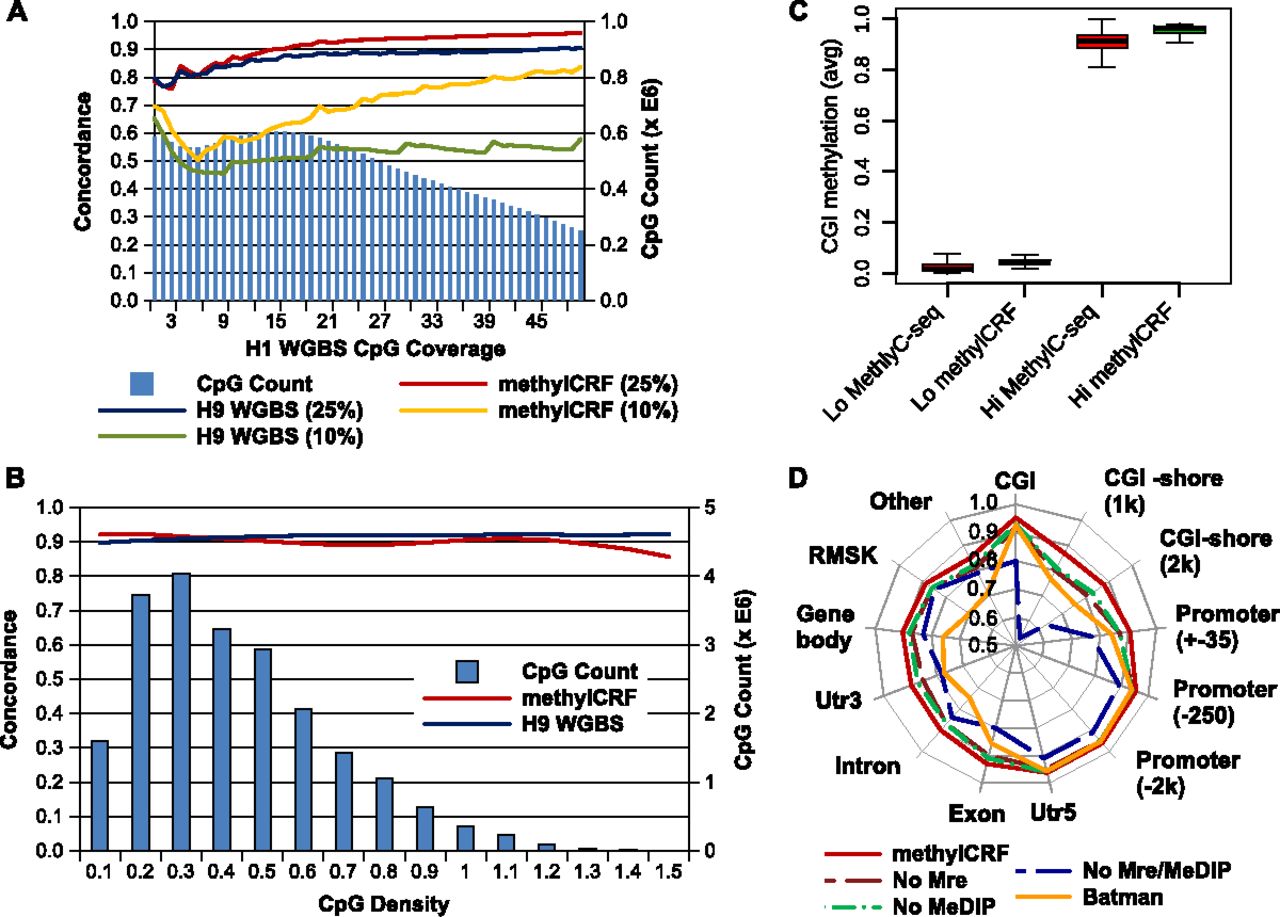
Factors affecting concordance between MethylC-seq and methylCRF. (A) Concordance with MethylC-seq as a function of MethylC-seq read count (CpG coverage) at 10% and 25% windows for both methylCRF and BS-seq. The right y-axis (blue bars) indicates the number of CpGs with that coverage. (B) Concordance with MethylC-seq as a function of CpG density at 25% windows for both methylCRF and BS-seq. (C) Concordance of methylCRF within a 25% window broken out by annotated genomic features when only MeDIP-seq, MRE-seq, or genomic features are used. Concordance of BATMAN using MeDIP-seq is also plotted for comparison. (D) methylCRF accuracy on CGIs with high or low methylation (as defined by MethylC-seq). The Lo set of CGIs are those with an average CpG methylation ≤0.2, while the Hi set are those with an average methylation ≥0.8.


