
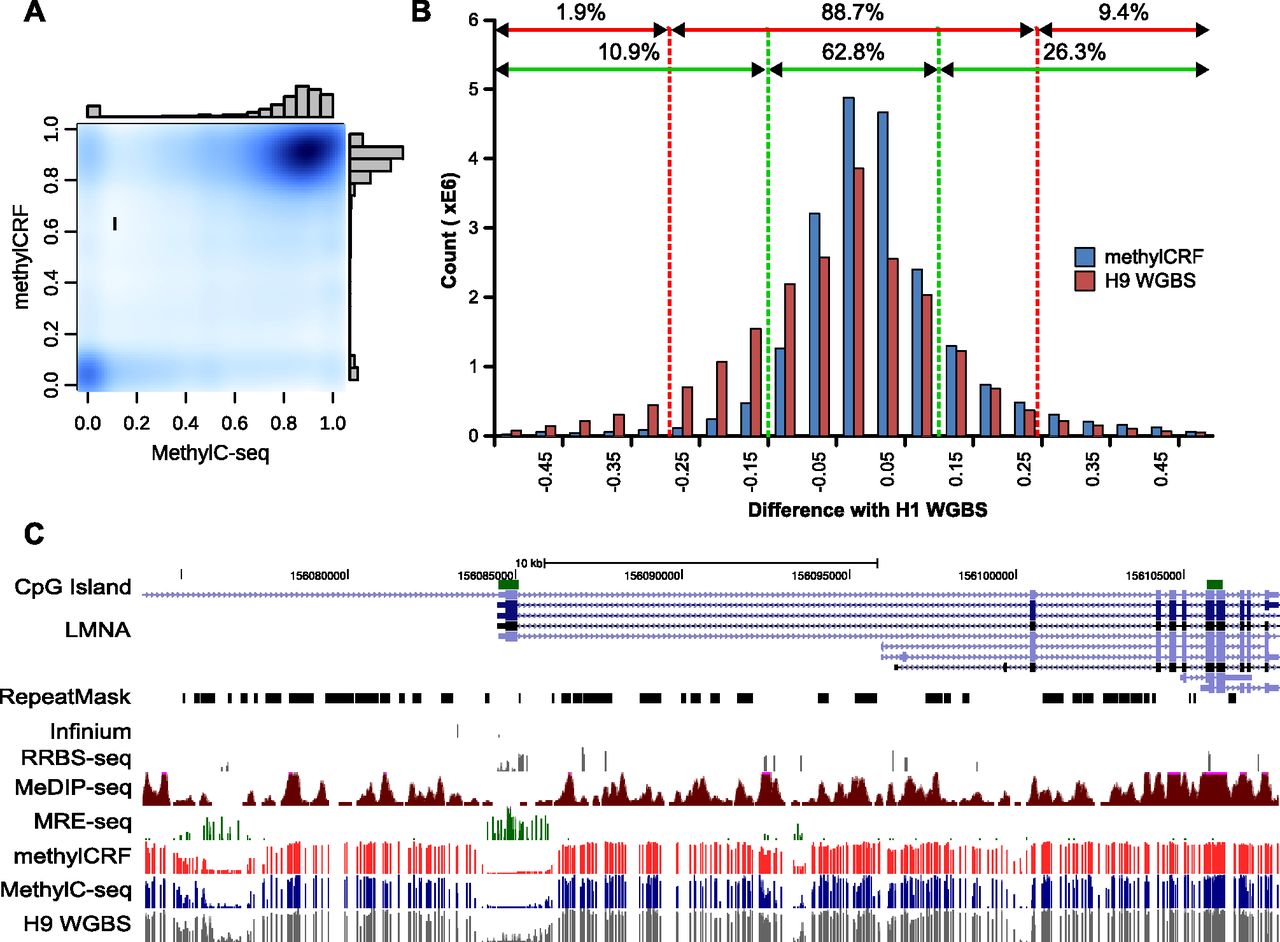
Concordance between MethylC-seq and methylCRF. (A) Kernelized density plot comparing H1 ESC (male) MethylC-seq and methylCRF methylation levels at each CpG with at least one MethylC-seq read. MethylCRF recapitulates the bimodal distribution of MethylC-seq. (B) The number of CpGs as a function of the difference between MethylC-seq and methylCRF methylation levels—the two agree within 25% for 91% of the CpGs and within 10% for 70% of the CpGs. The difference between BS-seq (H9 ESC, female) and MethylC-seq (H1 ESC) on common CpGs is also plotted for comparison. (C) Genome Browser view of per CpG methylation levels across a representative test region on chromosome 1.


