
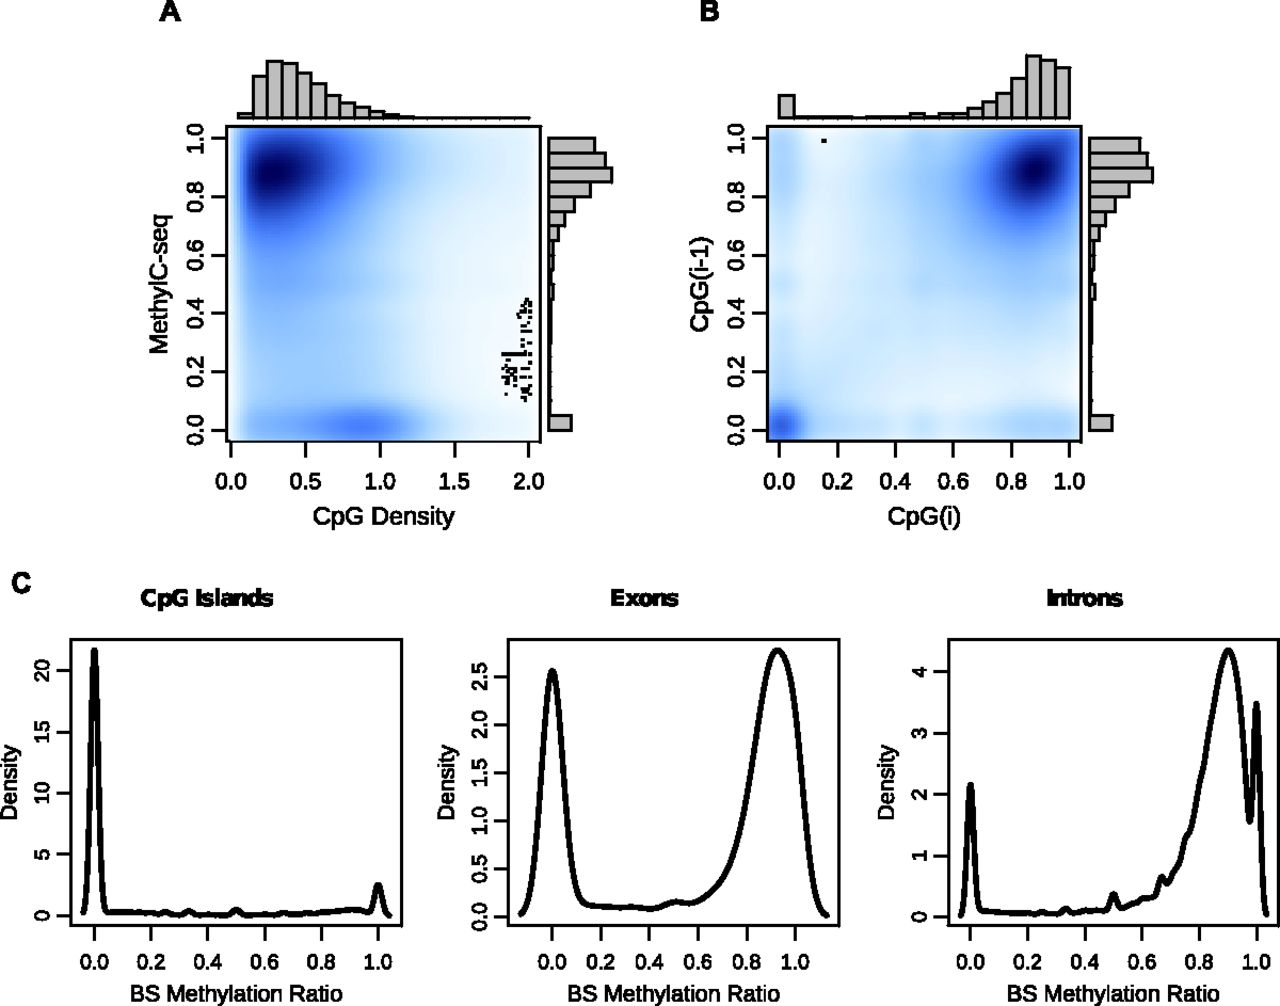
Figure 2.
CpG methylation levels are nonrandom throughout the genome. (A) A kernelized density plot of MethylC-seq methylation levels as a function of CpG density. Methylation varies in a CpG density–dependent manner with the majority of CpGs at 0–0.75 density with 75%–100% methylation and a smaller group at 0.75–1.25 density with almost 0% methylation. (B) CpG methylation levels as a function of their immediately 5′-CpG methylation level (up to 750 bp). (C) Distribution of MethylC-seq methylation levels at CpG islands, exons, and introns.


