
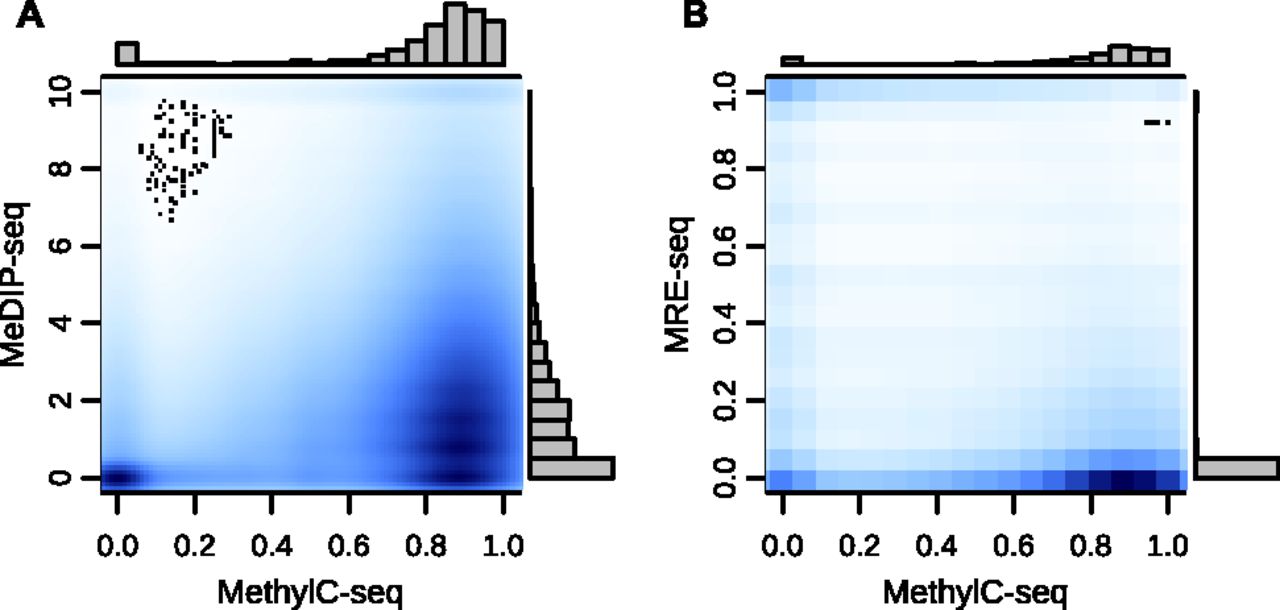
Figure 1.
Relationship between MeDIP-seq and MRE-seq and MethylC-seq. (A) A kernelized density plot of per CpG MeDIP-seq normalized read count values as a function of MethylC-seq methylation levels shows a complex, approximately proportional relationship. (B) MRE-seq normalized read counts as a function of MethylC-seq methylation levels shows a complex, approximately inversely proportional relationship.


