
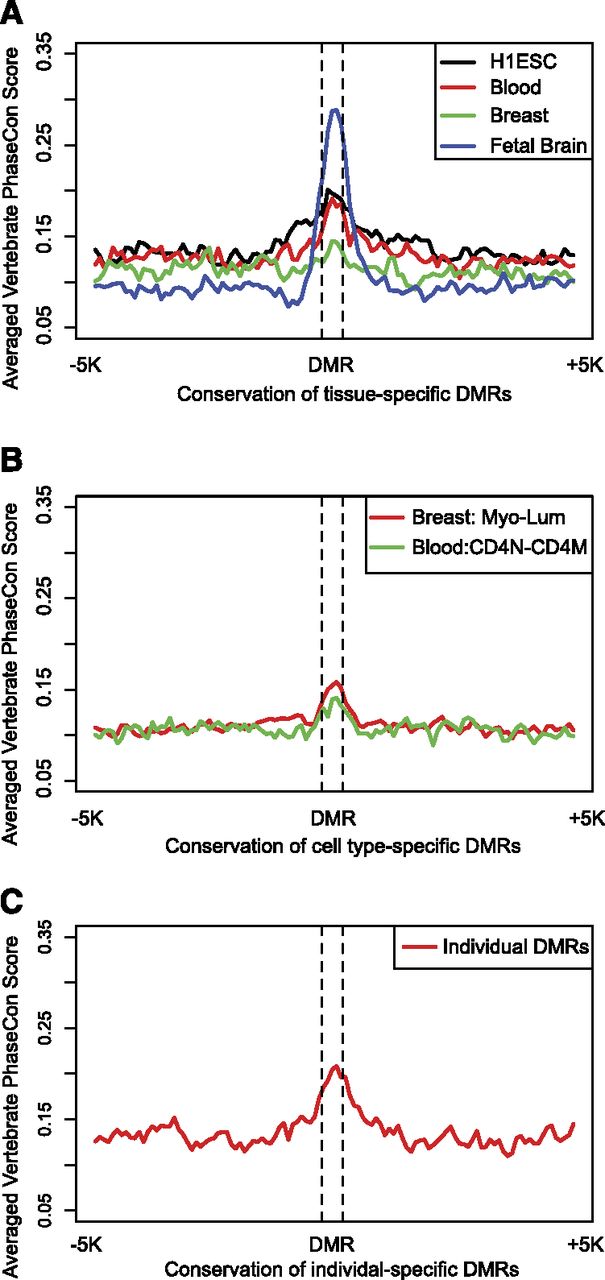
Figure 8.
Sequence conservation of DMRs. Vertebrate phastCon scores were obtained at 100-bp resolution for each DMR and their respective upstream/downstream 5-kb regions. Averaged scores in each 100-bp window were plotted. (A) Conservation of tissue-specific DMRs. (B) Conservation of cell type-specific DMRs. (C) Conservation of individual-specific DMRs.


