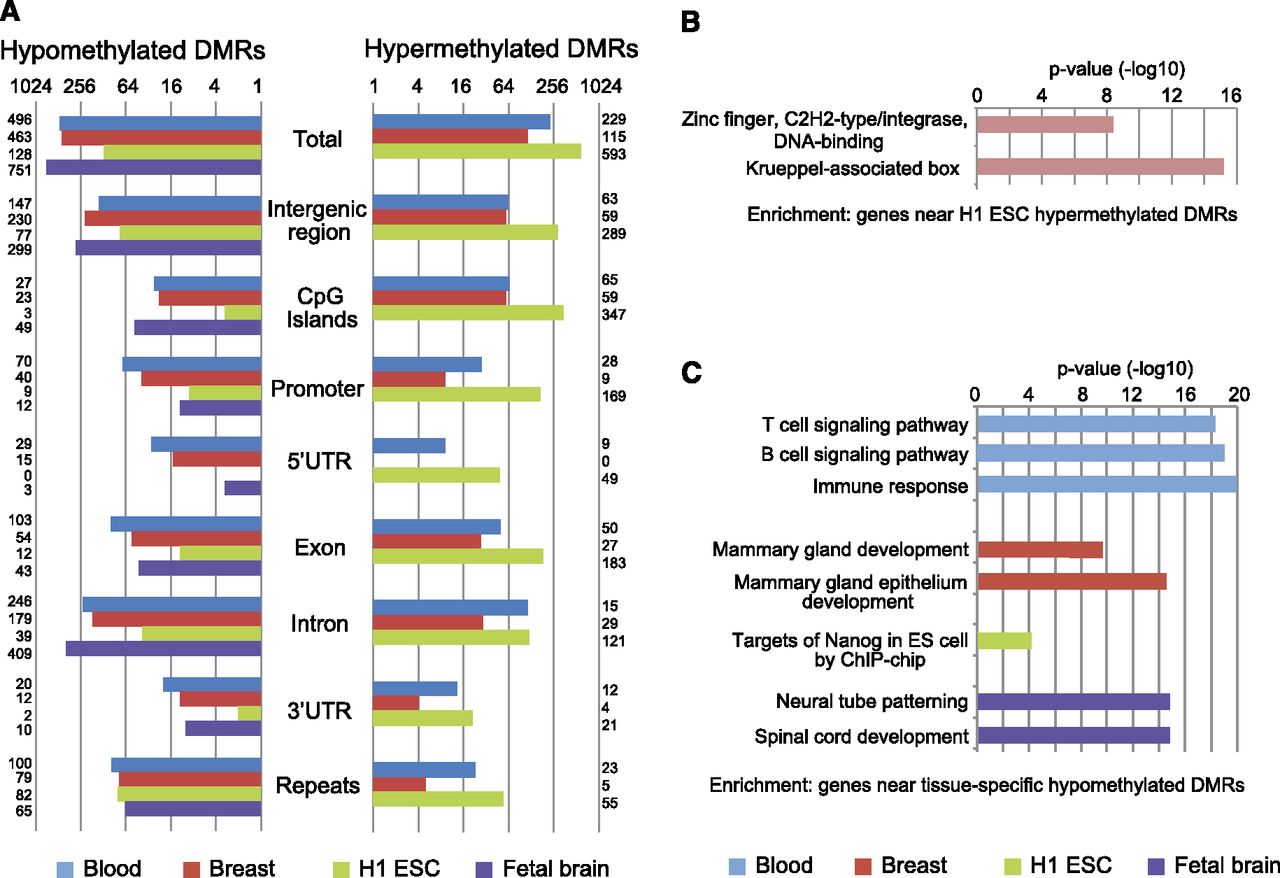
Functional DNA methylation differences between tissues, cell types, and across individuals discovered using the M&M algorithm

(Downloading may take up to 30 seconds. If the slide opens in your browser, select File -> Save As to save it.)

Click on image to view larger version.

Figure 3.
Figure 3.

Genomic distribution and functional enrichment of tissue-specific DMR. (A) Genomic distribution of tissue-specific DMRs. (B) Functional enrichment of H1 ESC-specific hypermethylated DMRs by GREAT analysis. (C) Functional enrichment of tissue-specific hypomethylated DMRs by GREAT analysis.

This Article

  1. Genome Res. 23: 1522-1540

Preprint Server