
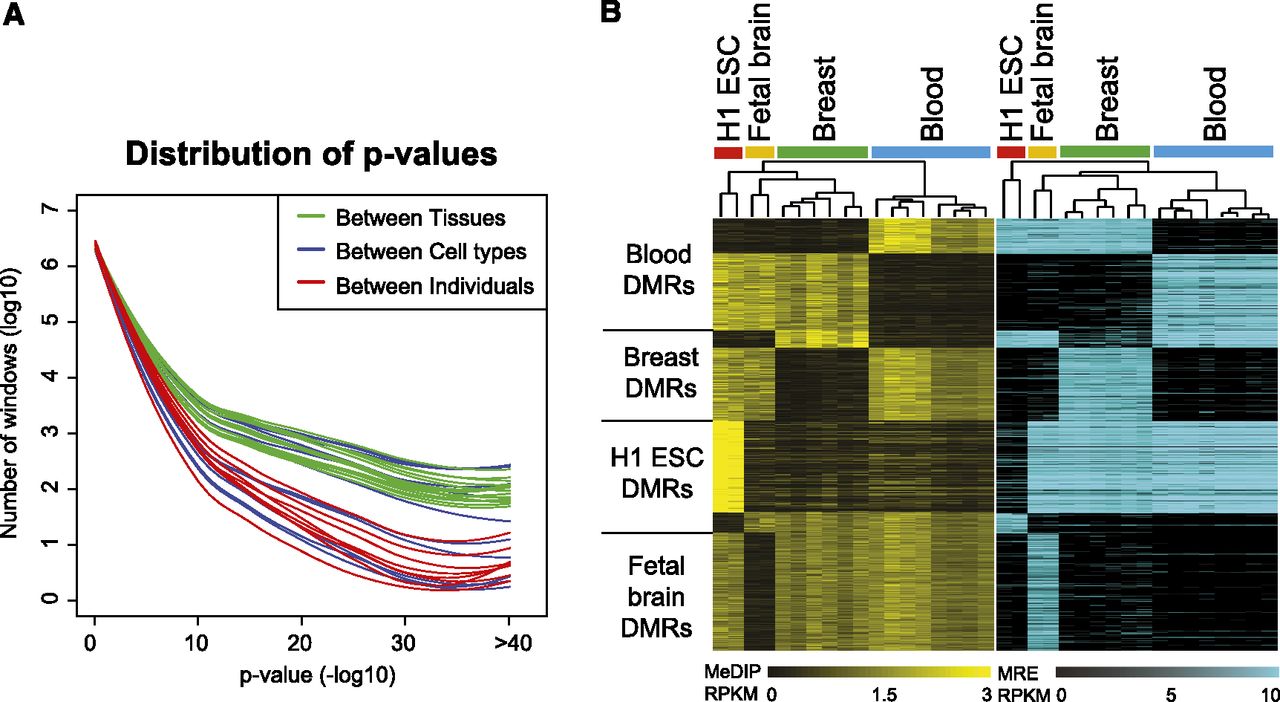
Figure 2.
M&M analyses of DNA methylation differences across multiple tissue types, cell types, and individuals. (A) P-value distributions of M&M predictions between tissue types (green lines), cell types (blue lines), and individuals (red lines). (B) Biclustering analysis of tissue-specific DMRs. (Left panel) Based on RPKM values of MeDIP-seq; (right panel) based on RPKM values of MRE-seq.


