
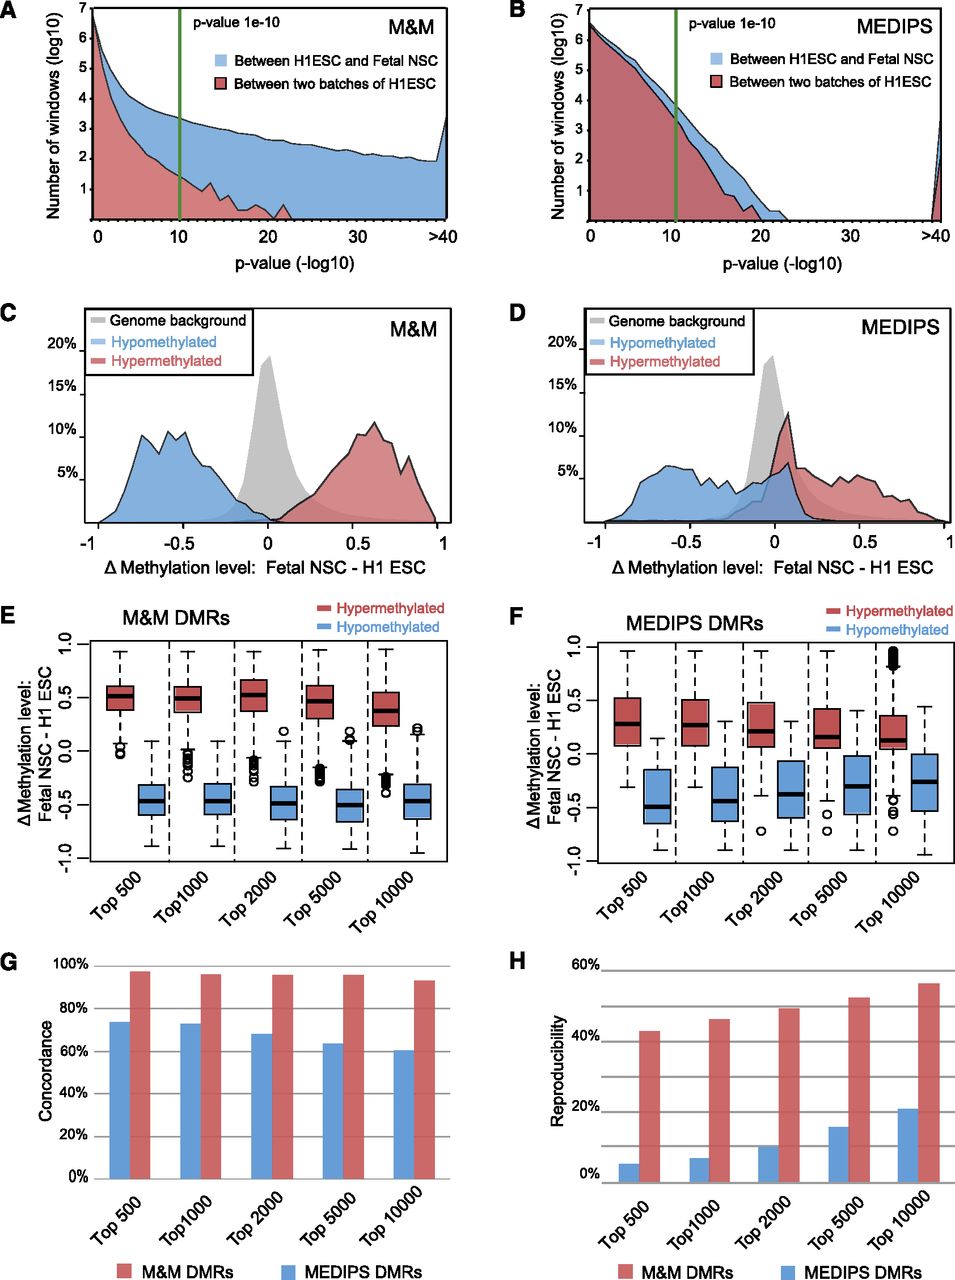
Benchmarking the performance of M&M. (A) The distribution of P-values generated by M&M when comparing two H1 ESC biological replicates (blue area) and when comparing H1 ESC and fetal NSC (red area). At a P-value cutoff of less than 1 × 10⁻¹⁰ (green line), M&M predicted 70 DMRs between the two H1 samples, and 16,398 DMRs between H1 ESC and fetal NSC. (B) The distribution of P-values generated by MEDIPS for the same comparisons as in A. At a P-value cutoff of less than 1 × 10⁻¹⁰ (green line), MEDIPS predicted 2066 DMRs between the two H1 ESC replicates, and 11,162 DMRs between H1 ESC and fetal NSC. (C) Whole-genome bisulfite sequencing (WGBS) data were used to validate DMRs predicted by M&M between H1 ESC and fetal NSC. DMRs predicted by M&M were ranked according to their P-values, then average DNA methylation levels for each of the top 1000 significantly hypermethylated DMRs (red) and the top 1000 significantly hypomethylated DMRs (blue) in fetal NSC were computed using WGBS data from the same two samples (H1 ESC and fetal NSC). Distribution of the DNA methylation level differences was plotted for hypermethylated DMRs and hypomethylated DMRs separately. The gray area represents the distribution of DNA methylation differences in the whole-genome background, calculated at 500-bp-window resolution using the same WGBS data sets. (D) Same as C, except that DMRs were predicted by MEDIPS. (E) DNA methylation differences between H1 ESC and fetal NSC were calculated using WGBS data for individual CpGs within the top 500, 1000, 2000, 5000, and 10,000 hypermethylated and hypomethylated DMRs (predicted by M&M, at varying cutoffs). These values were plotted as a boxplot. (F) Same as E, except that DMRs were predicted by MEDIPS. (G) Concordance between M&M (red) or MEDIPS (blue) predicted DMRs and differential methylation for these regions calculated from WGBS data. DMRs predicted by M&M and MEDIPS were ranked based on their P-values. At different cutoffs, DMRs were determined to be concordant with WGBS data (if differences in WGBS data were greater than 0.1 and were in the correct direction). (H) Reproducibility of DMR predictions in M&M (red) and MEDIPS (blue). DMR discovery was performed between two cell types from the same individual and repeated in a second individual. DMRs identified in each individual were ranked according to their P-values and intersected between the two individuals. The percentages of overlapping DMRs at different cutoffs were plotted.


