
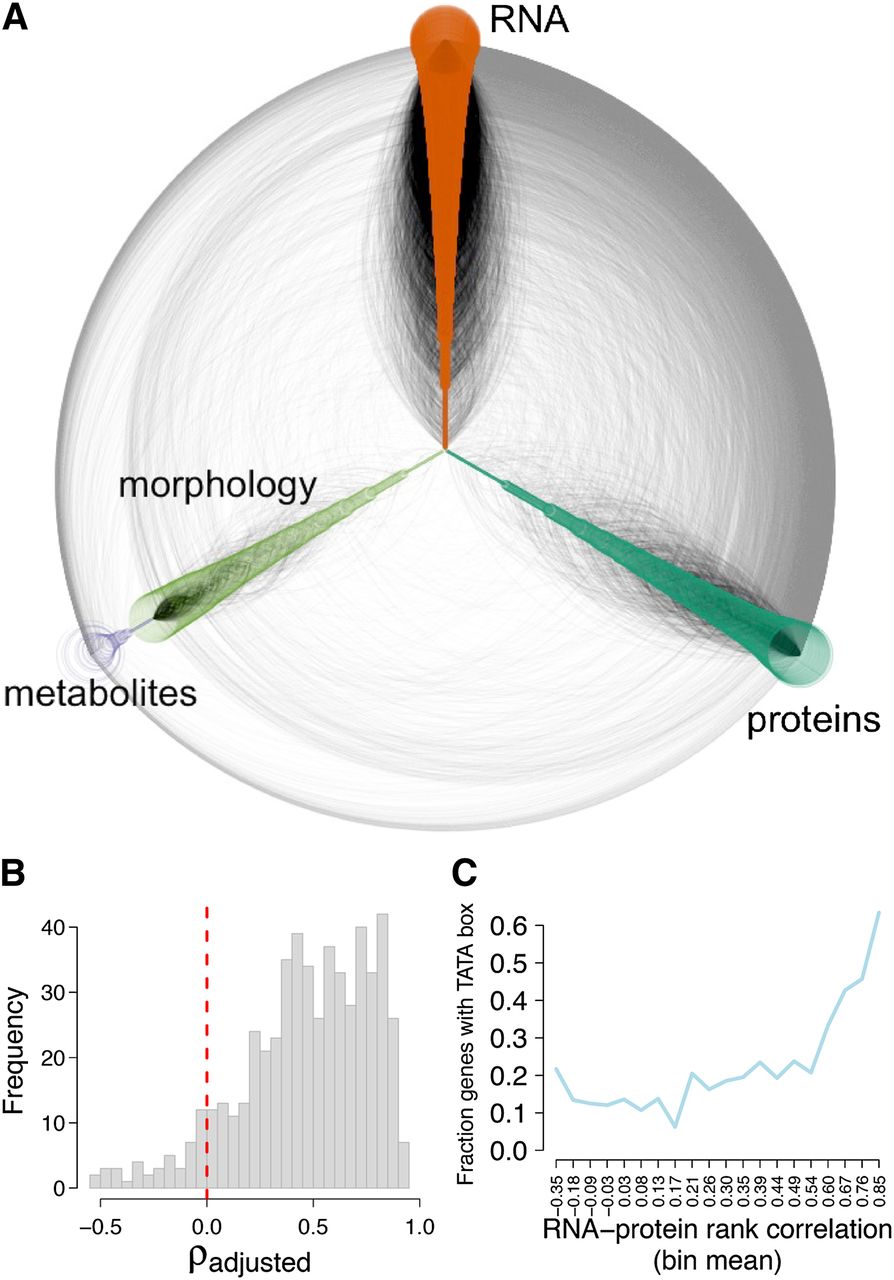
Dense network structure of phenotypic correlations. (A) Hive plot showing network composed of highly correlated phenotypic traits. Nodes arrayed along the three axes represent individual phenotypes, colored by data type as indicated. Lines drawn between nodes indicate a significant correlation between the two phenotypes. Black lines indicate connections within the same data type, and gray lines indicate connections between data types. (B) RNA-protein correlations for 542 genes with differentially expressed transcripts and at least one differentially abundant peptide. ρadjusted indicates a correlation calculated by subtracting from the true correlation the mean of correlations calculated from 1000 randomly reshufflings of the data. Vertical red dotted line is drawn at 0. (C) Fraction of genes containing a TATA box as a function of RNA-protein correlation. Each point plotted shows the fraction of genes with a TATA box among a bin of approximately 80 genes with similar RNA-protein correlations (bin means are labeled on the x-axis).


