
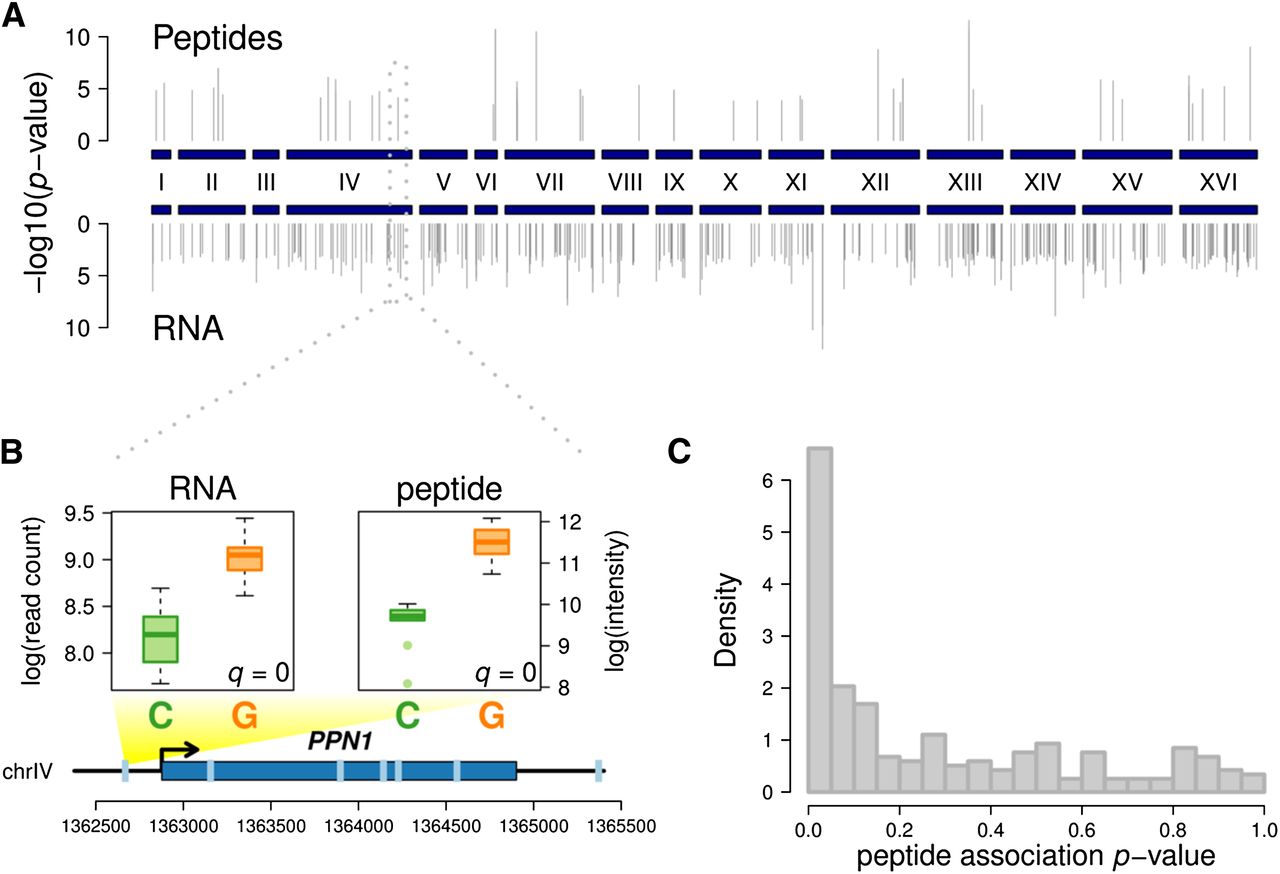
Cis-regulatory transcript and peptide QTL. (A) Manhattan plot showing results for significant (FDR = 5%) transcript and peptide cis-association tests. Gray vertical lines indicate individual tests. Blue boxes and associated roman numerals across the middle of the panel indicate the 16 chromosomes of yeast. (B) Transcript and peptide levels association with the same polymorphism. Light blue ticks along gene model indicate locations of tag SNPs tested for association. Transcript and peptide levels are significantly associated with the first SNP. Yellow gradient originating at first SNP expands to boxplots of transcript and peptide levels separated by allele; boxes indicate lower quartile, median, and upper quartile, and whiskers extend to half the interquartile range. (C) Histogram of P-values for 236 peptide associations in 69 genes with significant transcript associations.


