
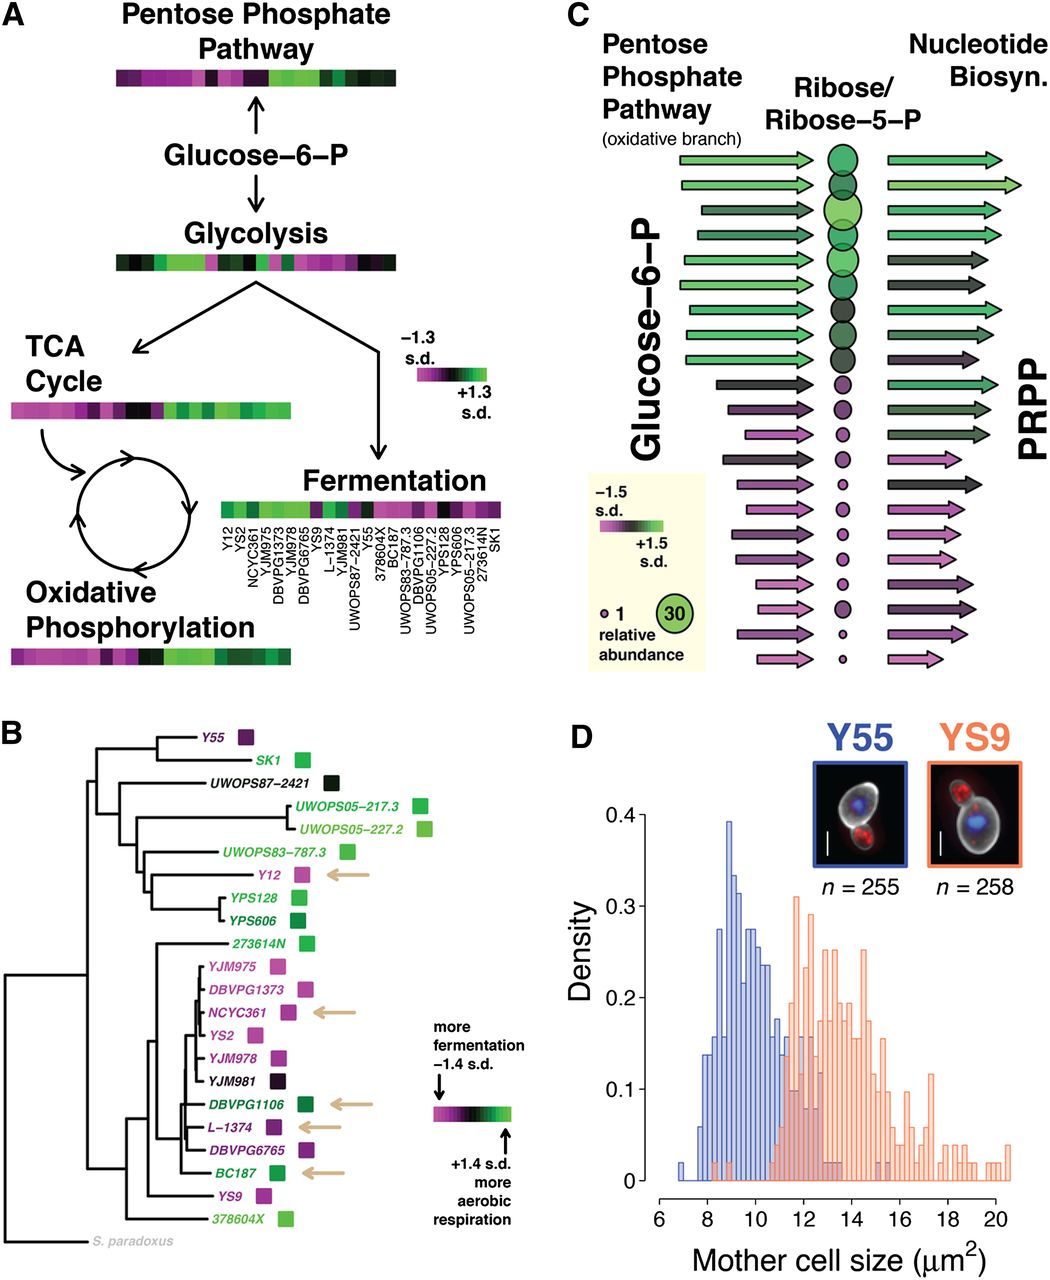
Pervasive heritable phenotypic variation. (A) Overview of central carbon metabolism, with heatmaps indicating pathway activity by strain. Transcript and protein data for genes in each pathway was combined, the first principal component extracted, and the numerical sign adjusted to ensure higher numbers corresponded to higher average transcript and protein abundance across the pathway. Order of strains is listed under the fermentation heatmap. (B) Phylogeny based on complete genome sequences, with strain names colored according to the key shown. Tan arrows indicate strains used in the fermentation of alcoholic beverages. Pathway activity for strains was calculated as in A, using genes in the tricarboxylic acid cycle (TCA cycle) and involved in fermentation. (C) Pathways leading to the production of phosphoribosyl pyrophosphate (PRPP) from glucose-6-phosphate, with pathway activity displayed vertically for 21 strains (Supplemental Note). Arrows represent pathway activity calculated as in A, with longer arrows/green indicating higher activity and shorter arrows/magenta indicating lower activity. Arrows on left indicate pathway activity of the oxidative branch of the pentose phosphate pathway, and on right activity of 5-phospho-ribosyl-1(alpha)-pyrophosphate synthetase, the heteromultimeric complex that synthesizes PRPP. Circles represent measurements of ribose/ribose-5-phosphate and are colored and sized accordingly. (D) Differences in mother cell size between a small and large strain. Histograms are composed of measurements made on individual cells. Inset photos show a typical cell from each strain (with size near the strain mean). White scale bars show ∼2 μm. Actin stain is shown in red, DNA stain in blue, and cell wall stain in greyscale in the merged images.


