
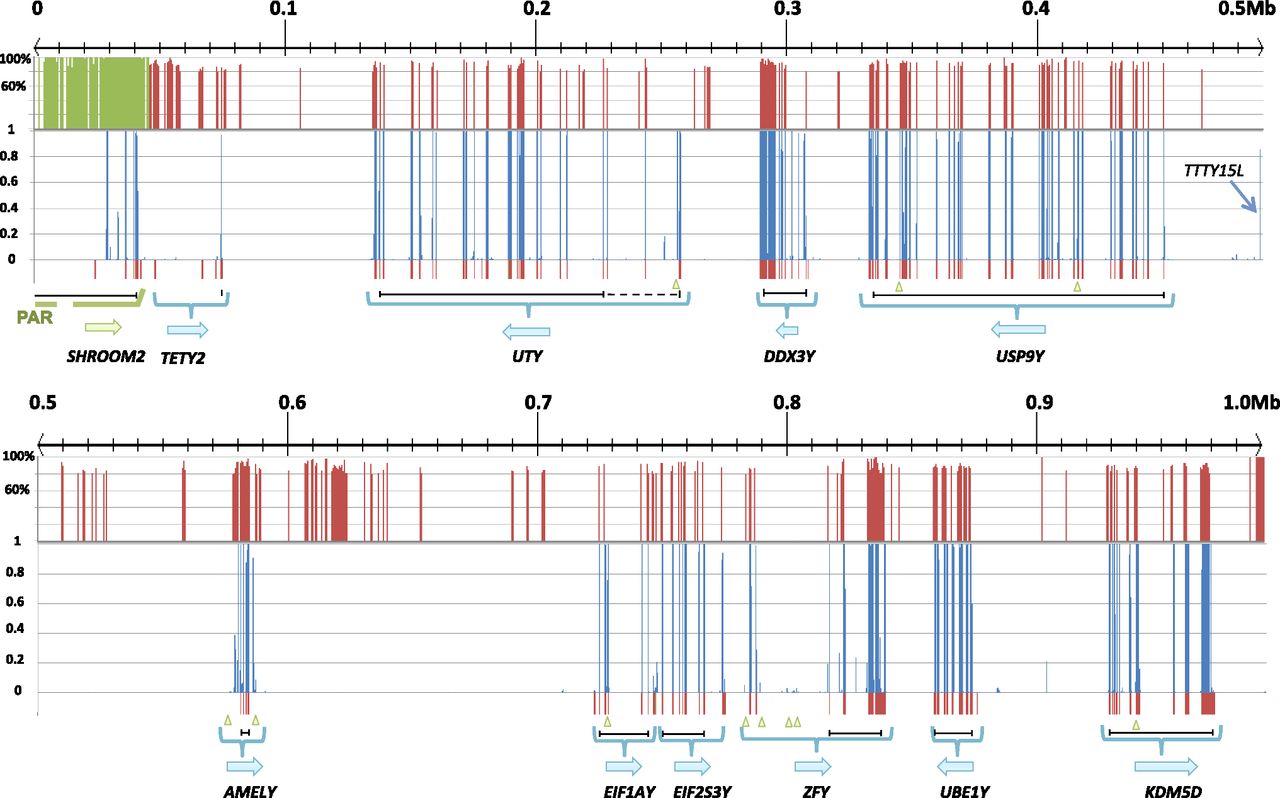
Sequence conservation across five mammalian Y chromosomes. The cat Y chromosome sequence is shown as the reference. Five-way (human, chimpanzee, rhesus, dog, and cat) sequence conservation is calculated and shown by blue columns (bottom panel). The conservation between cat X and Y chromosome sequences is shown by red/green columns (top panel). Gene boundaries are shown below each panel with blue brackets, with arrows defining orientation. Vertical red bars at the bottom of each panel indicate known gene exons. Green triangles along the bottom indicate the locations of conserved elements with potential secondary structure based on significant RNAz scores. Black lines at the bottom indicate the coding region span of each gene (dashed lines indicate conserved coding sequences identified in other mammals but not cat).


