
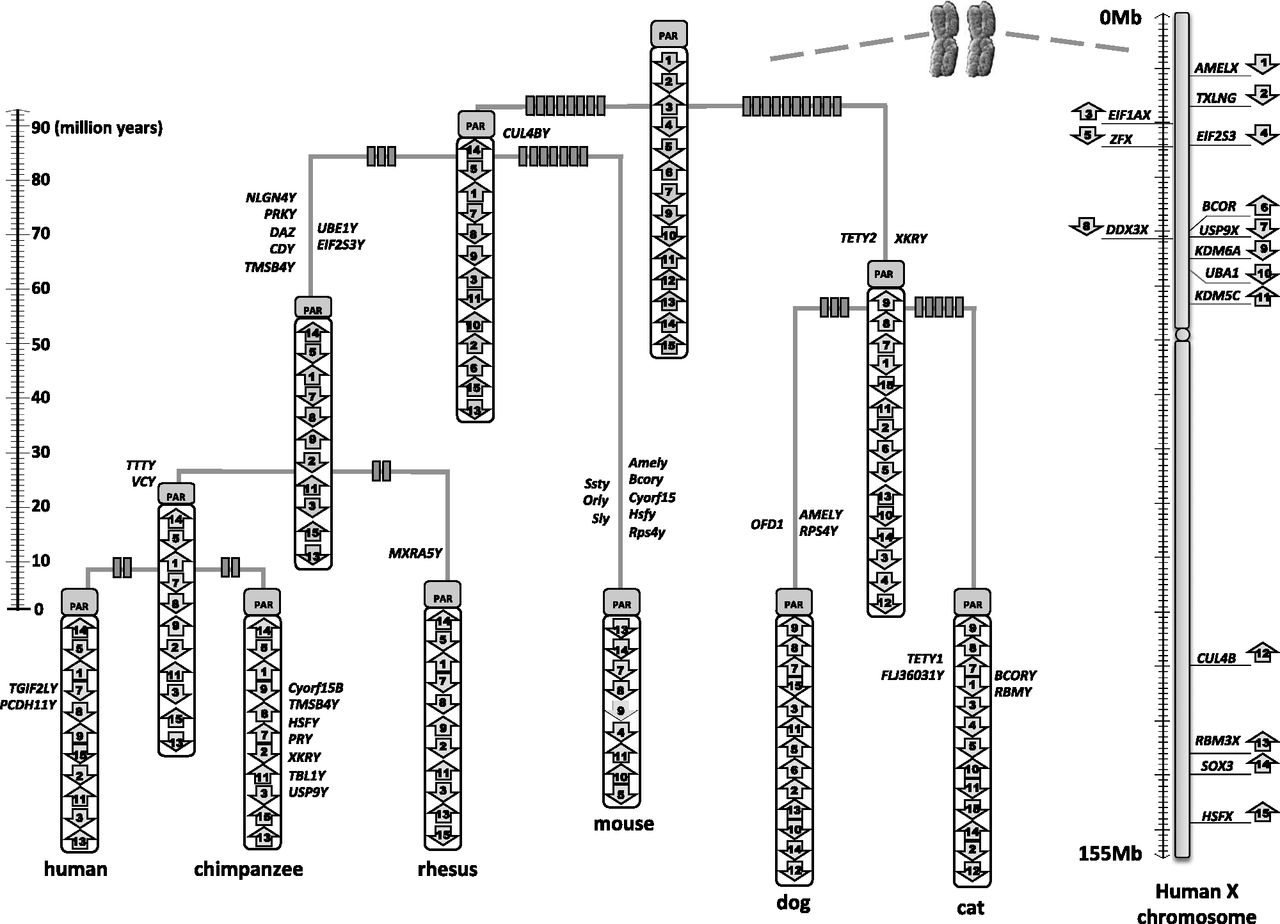
MSY chromosome rearrangements. Estimate of chromosome rearrangement and gain/loss events within the MSY of six mammalian Y chromosomes. Fifteen of 17 MSY chromosome genes present on the ancestral eutherian MSY are indicated by numbered arrows, with the name and location of the X chromosome gametologs displayed on the right. TSPY and RPS4Y are both dispersed multicopy gene families in multiple species and cannot be confidently assigned to a single position in the terminal taxa, nor in the ancestor. Arrows indicate the gene orientation within each chromosome. Rectangles on each branch represent the minimum number of rearrangements. Inferred gene losses are shown at the right side of each branch, while inferred gene gains are shown on the left side of each branch. Mouse physical mapping data are from Mazeyrat et al. (1998).


