
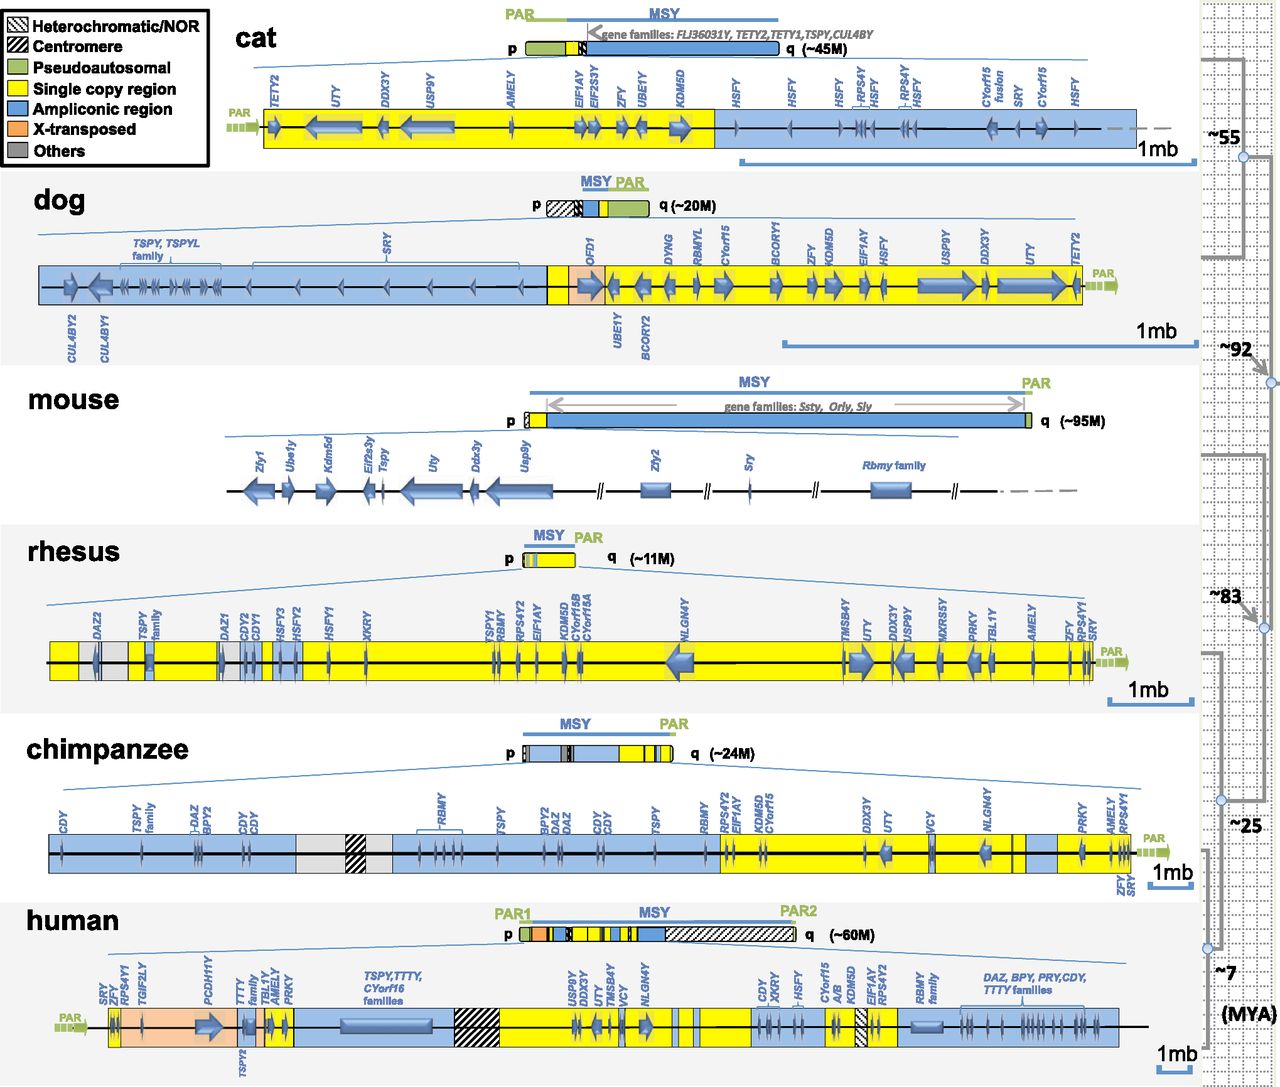
Figure 1.
Schematic representation of the MSY chromosome gene content of six mammals. Different gene/sequence classes are displayed in different colors (roughly following Skaletsky et al. 2003; Hughes et al. 2005, 2010, 2012 for clarity). Mouse physical mapping data are from Mazeyrat et al. (1998). Each sequence schematic is drawn to a different scale to emphasize differences in single-copy X-degenerate gene compaction.


