
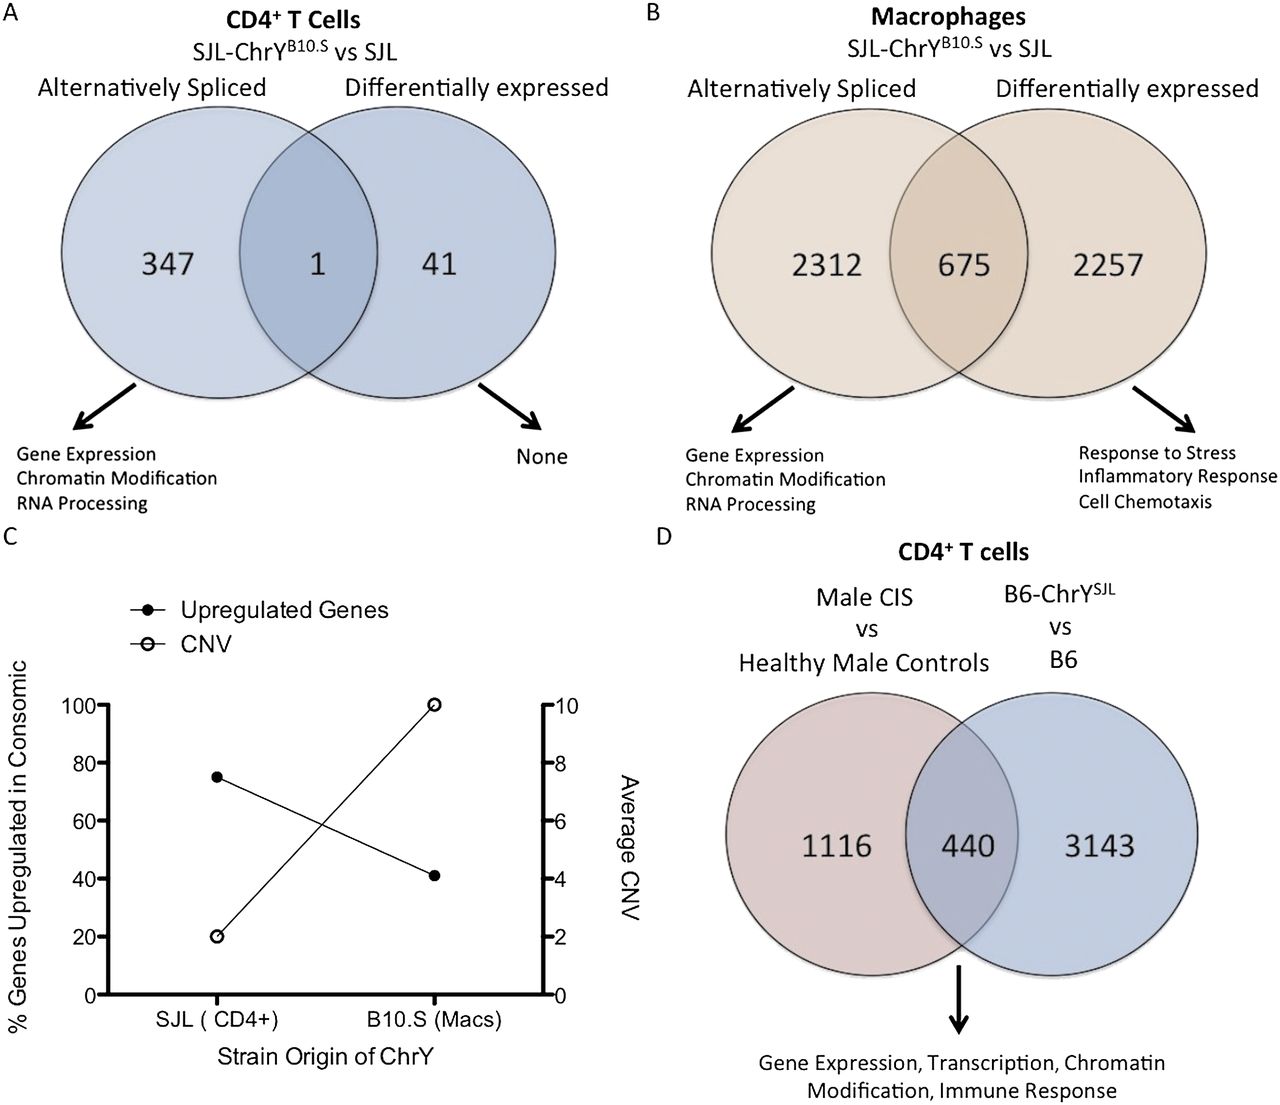
ChrY preferentially regulates the transcriptome of macrophages compared with CD4+ T cells in the SJL genetic background. Venn diagram representing the number of genes passing an FDR < 0.05 between SJL–ChrYB10.S and SJL. (A) CD4+ T cells and (B) macrophages. MGI GO Term Finder was used to identify enriched biological processes associated with each gene list, examples of which are shown. (C) Graph representing the percentage of up-regulated genes in the ChrY consomic strain vs. the parental in relation to the averaged copy number variation for Sly and Rbmy. (D) A Venn diagram representing the genes differentially regulated between the human and B6 mouse CD4+ T-cell microarrays, 440 of which are shared between the two species. MGI GO term analysis on these shared terms identified an enrichment of genes involved in gene regulatory processes.


