
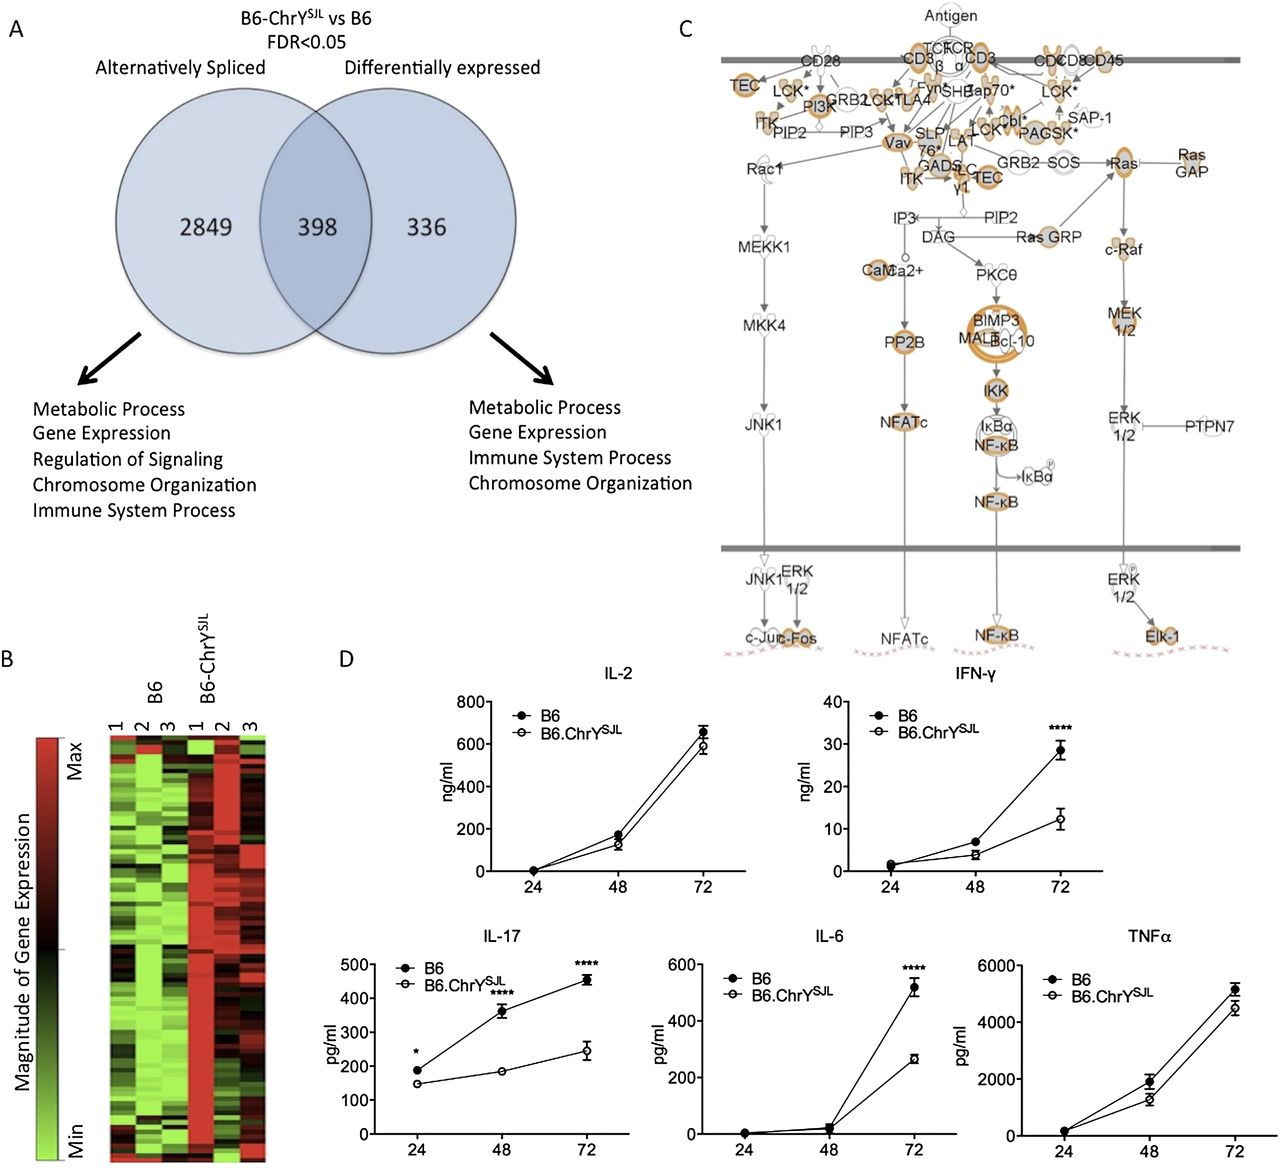
ChrY-mediated regulatory variation in genome-wide gene expression influences the activation profile of CD4+ T cells. (A) Venn diagram representing the number of genes passing an FDR < 0.05 between B6–ChrYSJL and B6 CD4+ T cells. MGI GO Term Finder was used to identify enriched biological processes associated with each gene list, examples of which are shown. (B) Heat map from quantitative PCR array specific for mouse epigenetic chromatin remodeling factors on three biological replicates of purified CD4+ T cells from B6 and B6–ChrYSJL. Red represents up-regulated genes and green down-regulated genes. Degree of change indicated by intensity of color. (C) IPA TCR signaling pathway with the molecules differentially regulated between B6–ChrYSJL and B6 CD4+ T cells highlighted in orange. (D) Purified CD4+ T cells from B6–ChrYSJL and B6 lymph nodes were incubated with anti-CD3 and anti-CD28 monoclonal antibodies and the supernatants were tested for IL2, IFNG, IL17A, TNF, and IL6 production after 24, 48, and 72 h by ELISA. Data are representative of three independent experiments. Significance determined by two-way ANOVA followed by Bonferroni post-hoc multiple comparison test. (*) P ≤ 0.05; (****) P ≤ 0.0001.


