
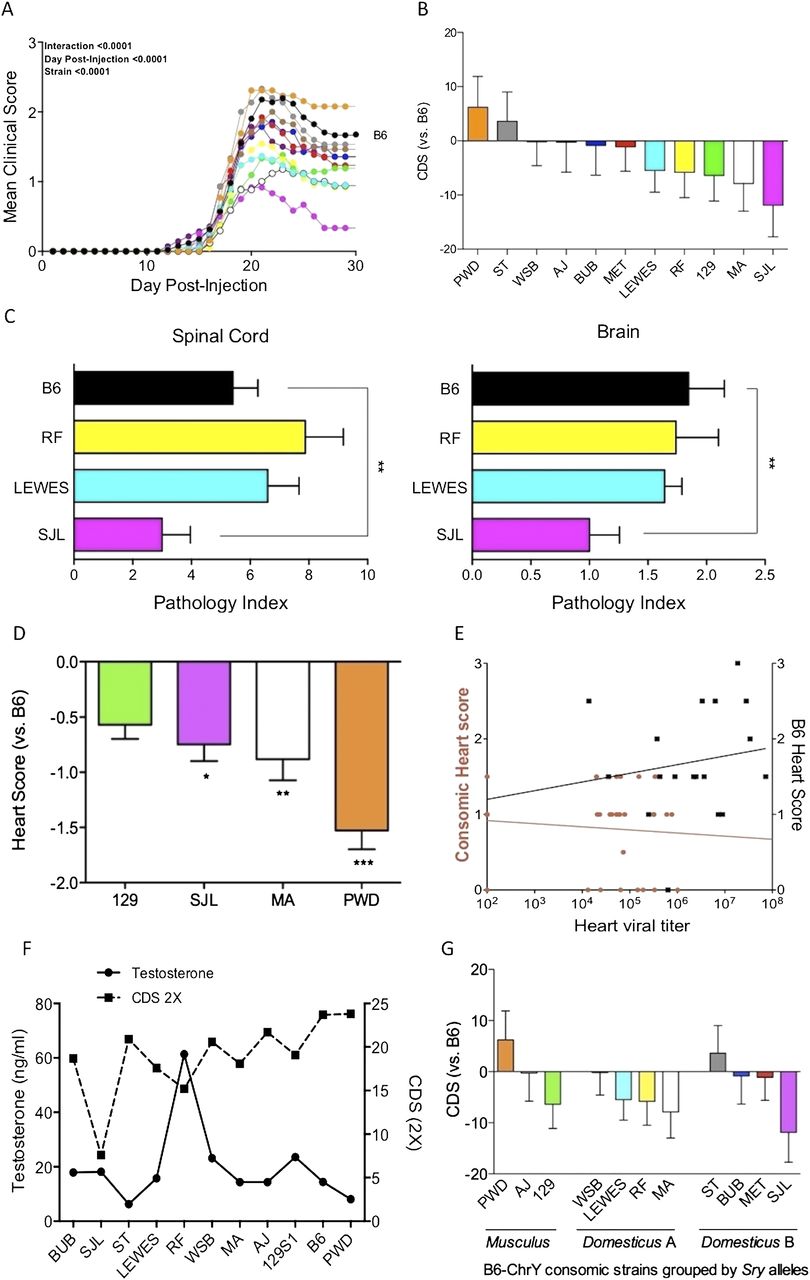
Natural genetic variation in ChrY mediates susceptibility to autoimmune disease. (A) Male mice from the B6–ChrY consomic strains were immunized with MOG35–55 using the 2× protocol and the clinical score was monitored over 30 d. The consomic strain represented by each line is color-coded with the bar graph in B. Wild-type B6 male are represented by black circles. The significance of the differences in disease course among the strains was determined by two-way ANOVA (interaction [F = 1.18; DFn = 319; DFd = 7770; P = 0.02], day post-injection [F = 132.81; DFn = 29; DFd = 7770; P < 0.0001], and strain [F = 23.53; DFn = 11; DFd = 7770; P < 0.0001]). (B) The degree of EAE susceptibility among the B6–ChrY consomic mice was calculated by subtracting the clinical disease score (CDS) of B6 from the CDS of each strain. The x-axis indicates the strain origin of the Y chromosome. F = 2.58, P ≤ 0.0009. A heterogeneity test was used between cohorts of mice with no significant differences detected. Thus, data were pooled from three independent experiments and the total number of animals analyzed in A and B are indicated in Supplemental Table S1. (C) Immunohistopathology of the brain and spinal cord from B6–ChrY consomic strains immunized using the 2× protocol. Only the total histopathology score is shown. Significance determined by one-way ANOVA. (**) P ≤ 0.01. (D) Male mice from wild-type B6 and four consomic lines were infected with 50 PFU CVB3 and their hearts were evaluated for myocarditis. Heart score of B6 was subtracted from the heart score for each consomic. Labeling on the x-axis represents the strain donating ChrY to B6. Results are representative of three individual experiments. n ≥ 5 mice per strain. Significance determined by one-way ANOVA and Dunnett's multiple comparison test. (*) P ≤ 0.05; (**) P ≤ 0.01; (***) P ≤ 0.001. (E) Linear regression analysis of heart score and heart viral titers reveals the absence of a significant relationship between the regressed variables. Left x-axis (orange linear regression line and orange circles) corresponds to the B6–ChrY consomic data combined from each of the four tested strains. F = 0.72, P = 0.41. Right x-axis (black linear regression line and black squares) corresponds to the WT B6 data. F = 0.43, P = 0.52. (F) Correlation analysis of serum testosterone with the CDS for EAE (r = 0.36; P = 0.27). (G) Functionally significant Sry polymorphisms are discordant with ChrY-mediated differences in disease susceptibility. Data from B were grouped according to their functional Sry polymorphisms.


