
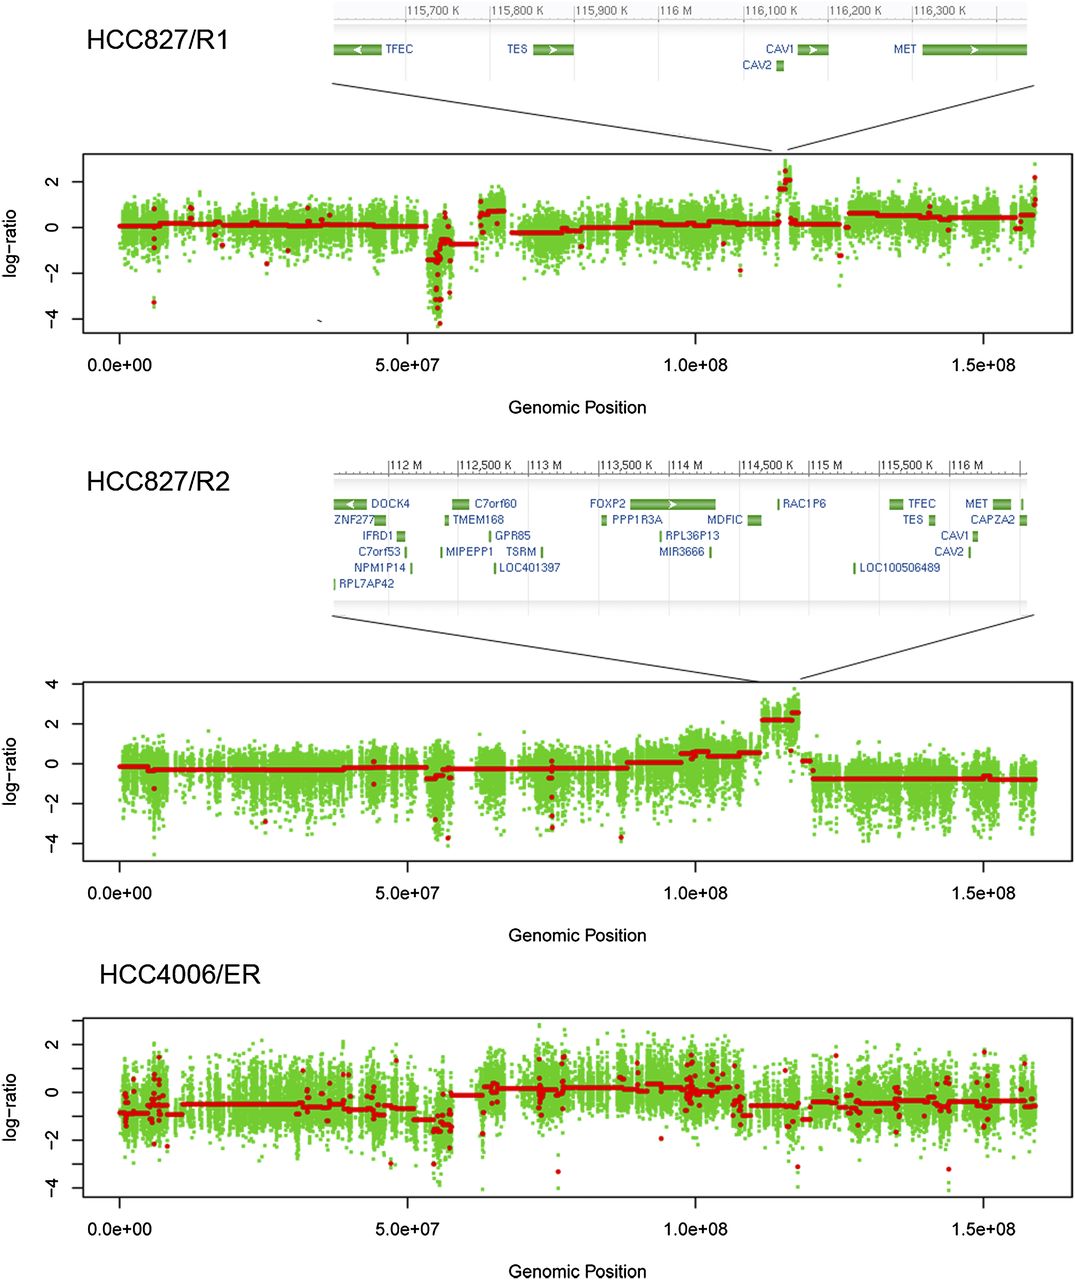
Figure 3.
Copy number variation (CNV) regions on chromosome 7 for HCC827/R1, HCC827/R2, and HCC4006/ER cells. (X-axis) Genomic position; (y-axis) log2 ratio of CNVs in resistant versus sensitive cells. Red lines indicate the segments. The size of the MET amplicon is different in HCC827/R1 and HCC827/R2 cells. See text for details.


