
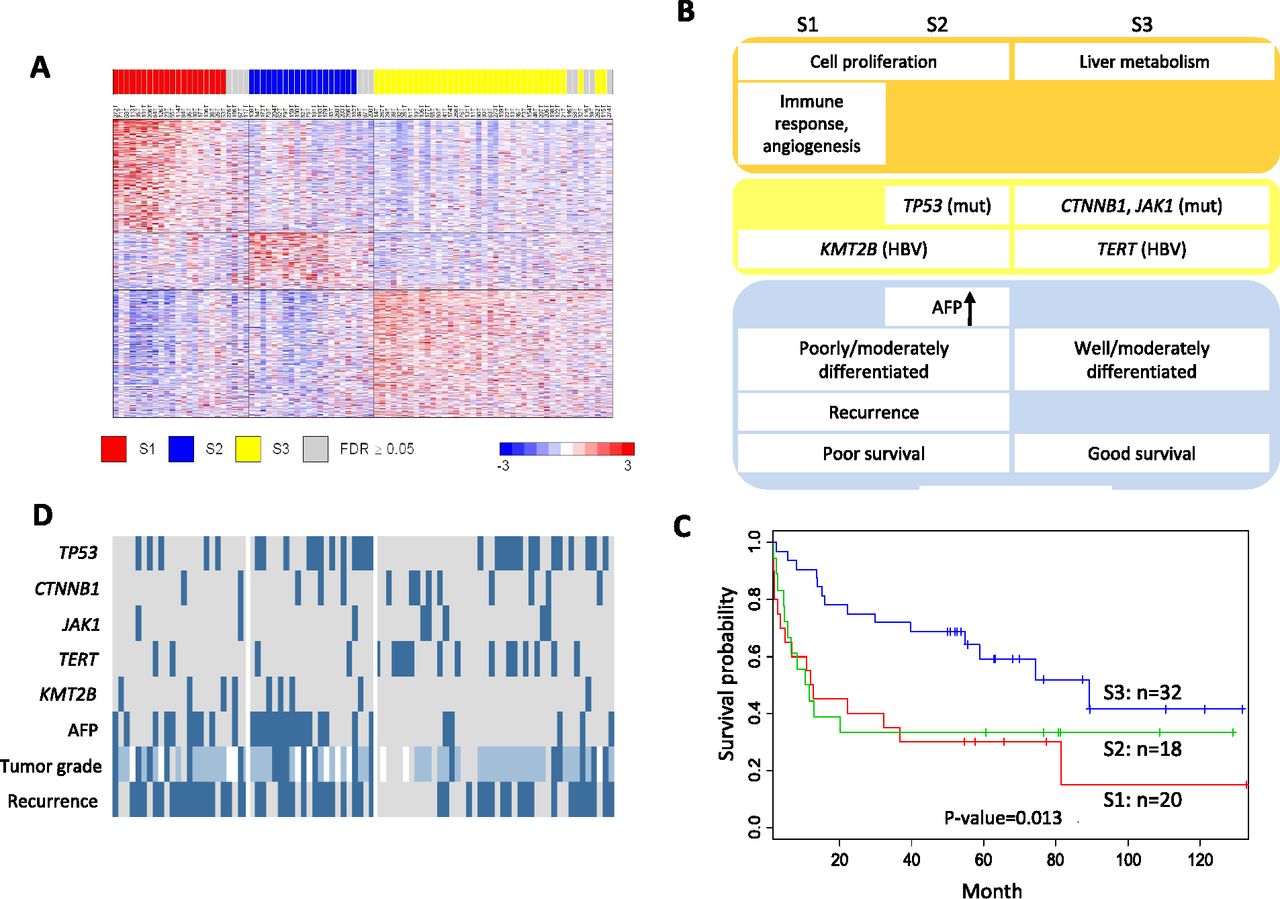
Molecular subclassification of HCC. (A) Gene expression profile of previously defined signatures (Hoshida et al. 2009) in three HCC subclasses. High and low expressions are represented by red and blue color, respectively. Seventy-six of the 88 tumors (86%) are assigned to subclasses with high confidence (FDR < 0.05). (B) Genetic and clinical profiles of the three HCC subclasses. Tumors with somatic SNVs in CTNNB1, TP53, and JAK1, HBV integrations into TERT and MLL4 (also known as KMT2B), AFP level >400 ng/mL, or tumor recurrence are represented by dark blue color. For tumor grade, poor, moderate, and well differentiation are represented by dark blue, light blue, and gray color, respectively. Tumors with missing tumor grade information are shown in white. (C) Kaplan-Meier survival plot for the three HCC subclasses. (D) Schematic summary of gene expression, genetic, and clinical profiles for each HCC subclass.


