
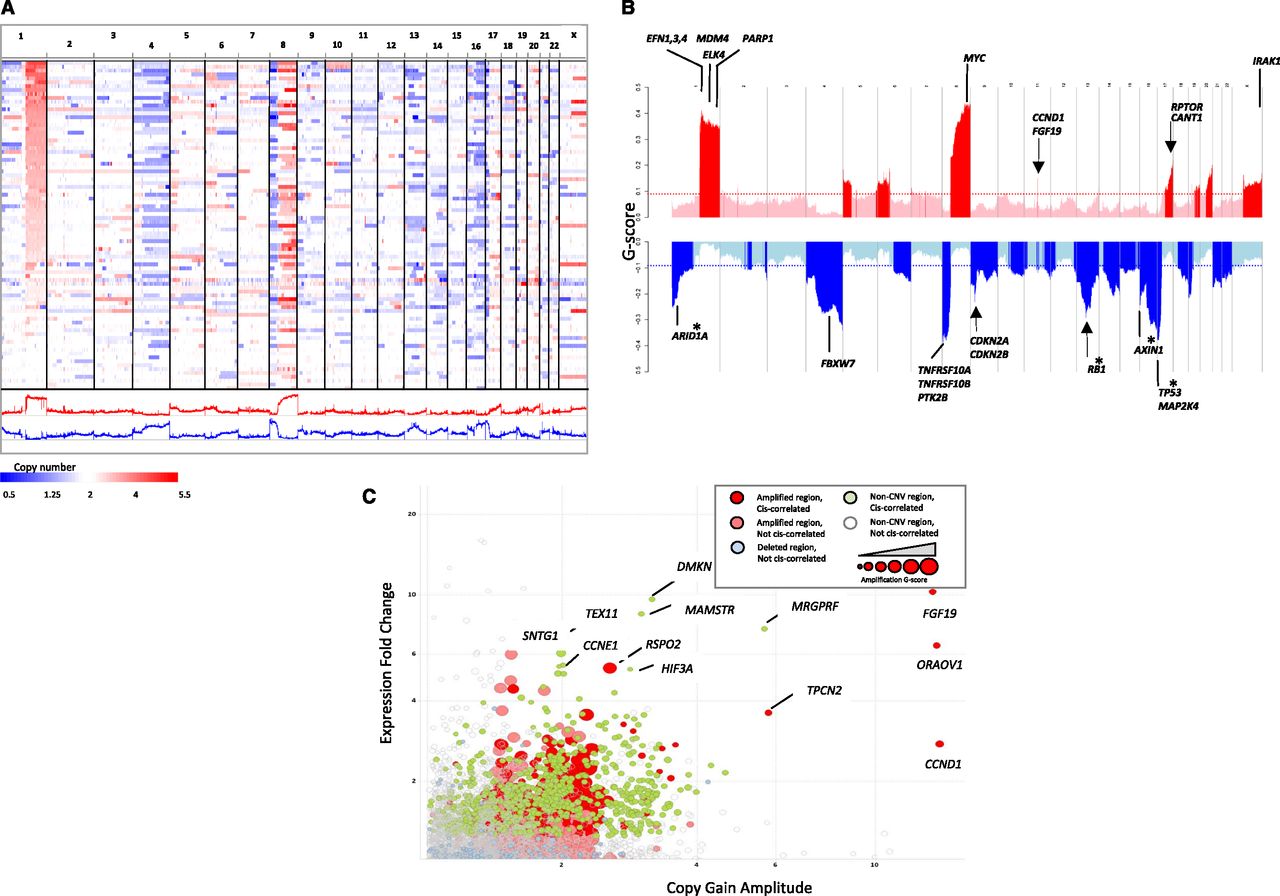
Landscape of genomic copy number alteration in HCC. (A) Shown is a genome-scale overview of copy number segments across 88 HCC samples rendered by IGV (Robinson et al. 2011). Each track in the upper panel represents one tumor sample, and the lower panels show the amplification and deletion G-score profiles across the genome. (B) Shown is a chromosomal overview of amplification and deletion peaks with the locations of putative cancer driver genes indicated. Arrows indicate focal peaks (<100 kb). Asterisks indicate genes also harboring nonsense mutations. (C) A log-scale plot of gene-level expression fold-change in CNV relative to non-CNV samples versus amplitude of copy gains. Genes with strong increase in expression driven by copy gains are labeled. Colors and shadings were used to indicate the CNV and cis-correlation statuses of genes. The size of the marker is proportional to the amplification G-score.


