
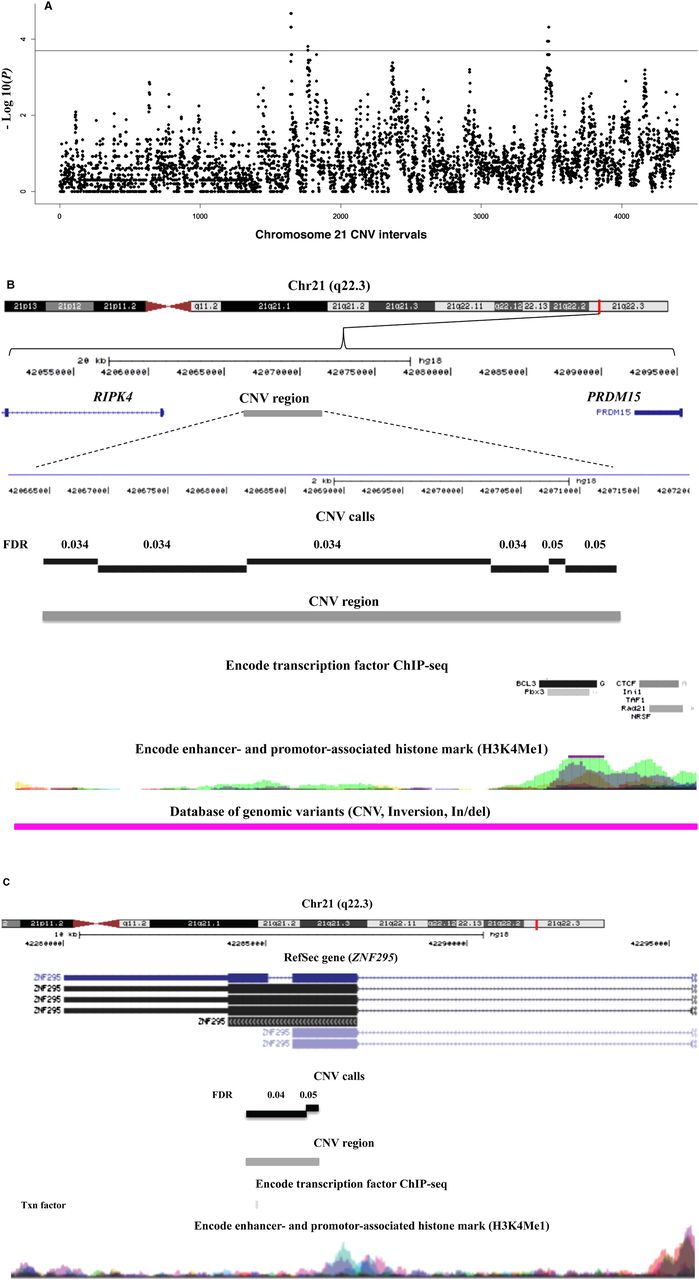
(A) Chromosome 21–wide Manhattan plot of P-values for DS-AVSD across 4401 consecutive chromosomal regions for CNV association. The P-values are calculated by a two-by-three Fisher's exact test. (Horizontal line) The FDR threshold for chromosome 21–wide α ≤ 0.05; CNV tests are plotted in equidistance. Three CNV regions reached genome-wide significance (FDR ≤ 0.05). (B) Overview of the CNV1 region (Chr21: 42,066,443–42,071,313) 6 kb upstream of the RIPK4 gene. This 4870-bp CNV region (in gray) is defined by merging six contiguous CNV tests (in black) (for details, see text). CTCF, REST, and other transcription factor binding sites are present in this region as well as the histone mark H3K4me1 (data from http://genome.ucsc.edu/ENCODE/). Additionally, an inversion (in pink), reported in the database of genomic variation, overlaps with this CNV region. (C) Overview of the 1820-bp CNV2 region (Chr21: 42,284,480–42,286,300) defined by merging two contiguous CNV tests overlapping with the last exon of the ZBTB21 gene.


