
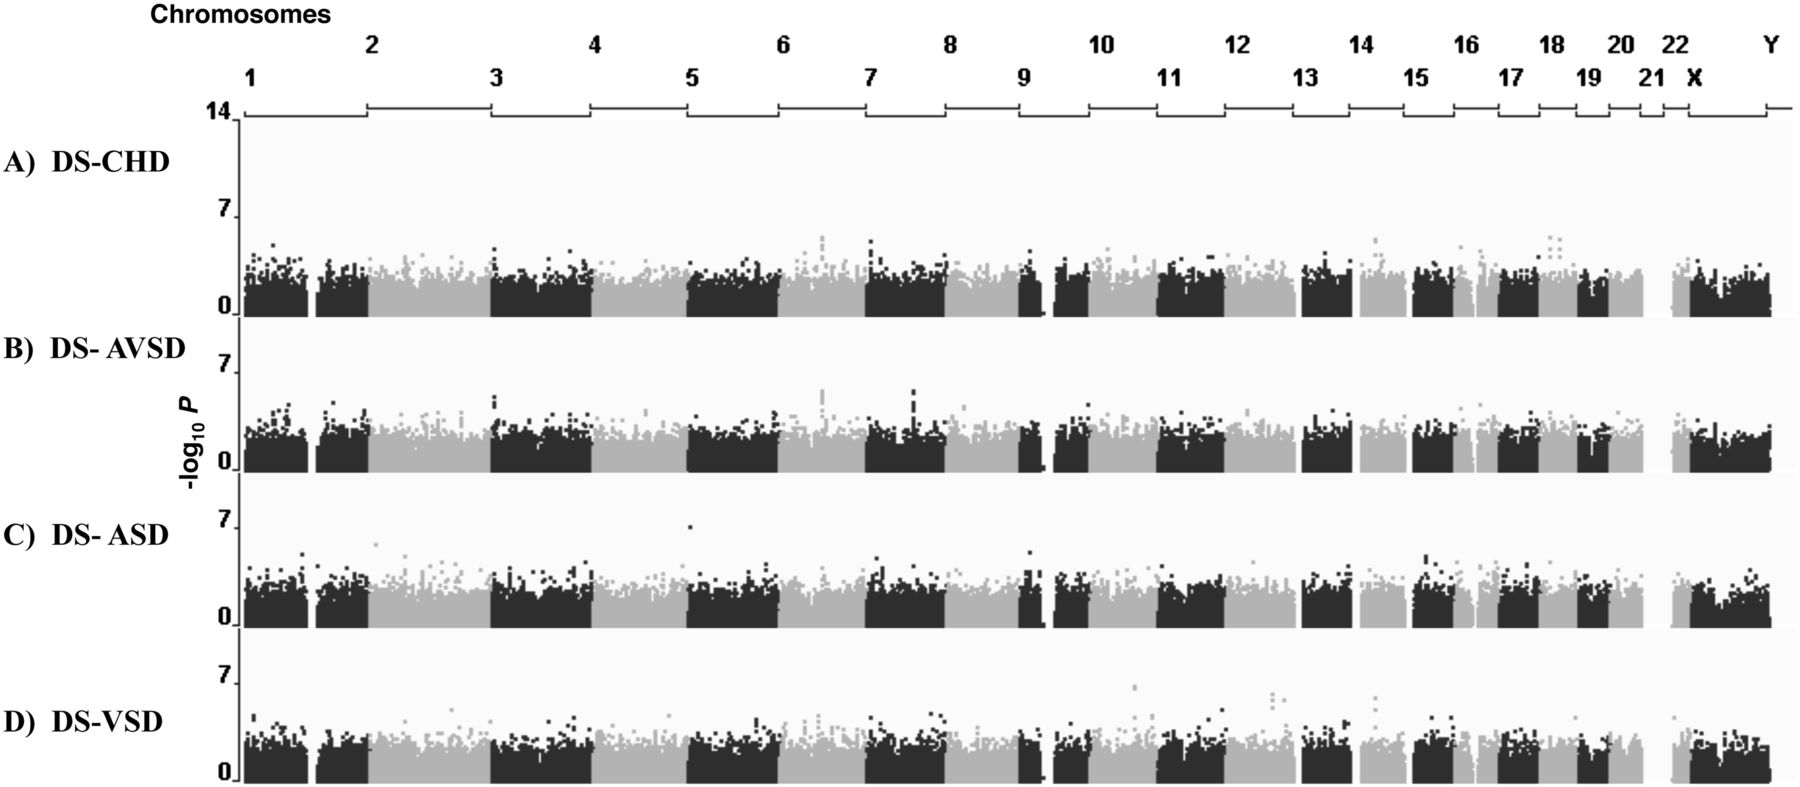
Figure 1.
Genome-wide Manhattan plots for CHD in DS and its different subphenotypes across 431,962 SNPs based on allelic associations. −log10 P-values of SNP association tests are plotted relative to their position on each chromosome (alternating black and gray). Chromosome 21 trisomic SNPs are not included here (for details, see text and Fig. 2). The results shown are for DS-CHD (A), DS-AVSD (B), DS-ASD (C), and DS-VSD (D).


