
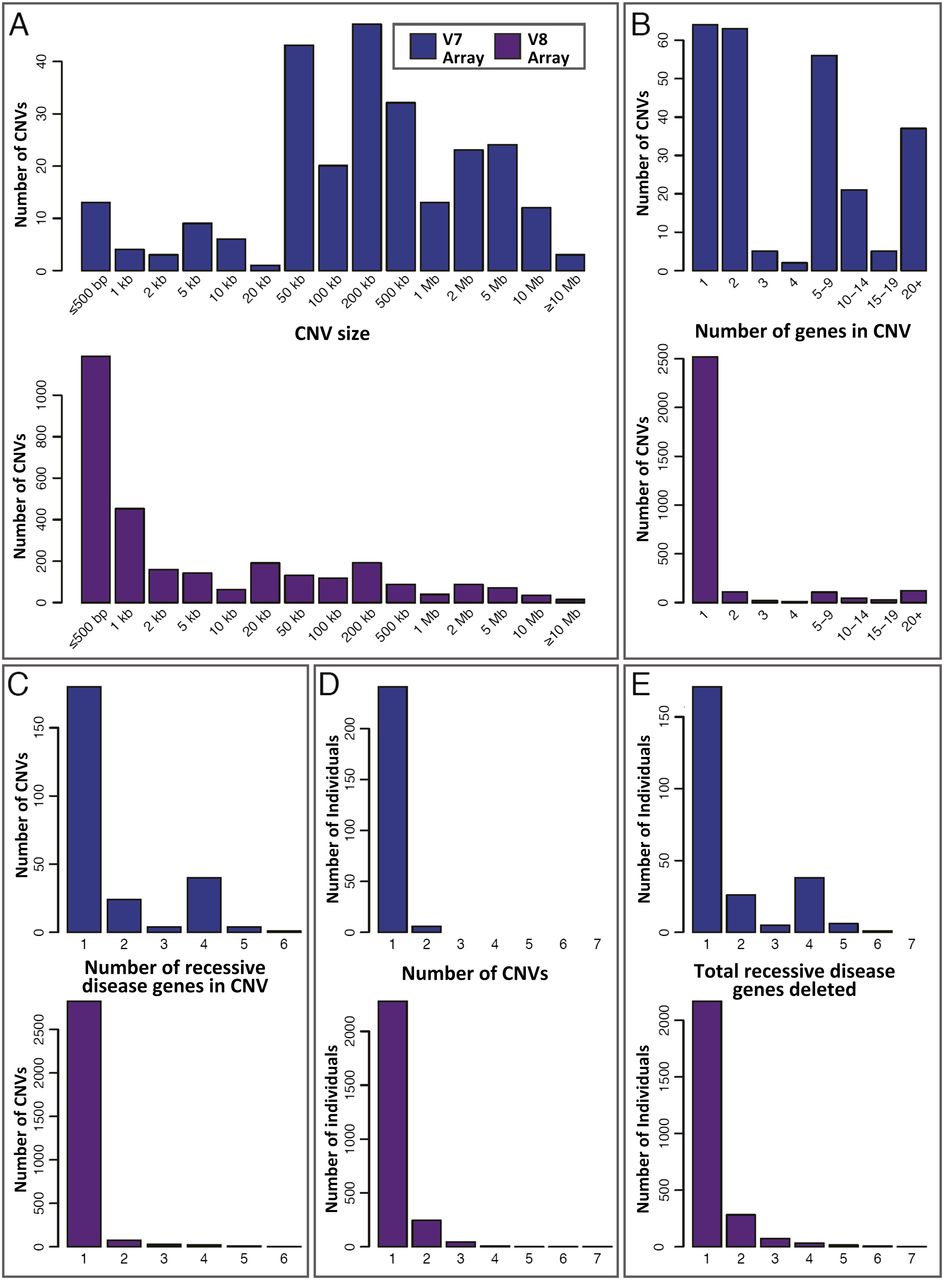
Attributes of the 3212 Tier 1 heterozygous deletions (potential carrier CNVs). Data are divided by array version (V7, blue; V8, plum) and based on the minimum deleted interval of each CNV. (A–C) The distributions of (A) deletion size, (B) number of RefSeq genes contained within each deletion, and (C) recessive disease genes per deletion. The spectrum of deletions identified by the V8 (exon-focused) array contains proportionally more small, single-gene events. (D) Distribution of heterozygous Tier 1 deletions per subject. A total of 18,641 subjects had no heterozygous Tier 1 deletion and are not shown. (E) Distribution of total recessive disease genes deleted per individual. This is an estimate of the distribution of per-person recessive carrier load attributable to copy-number variation. Individuals with no heterozygous Tier 1 deletion are omitted.


