
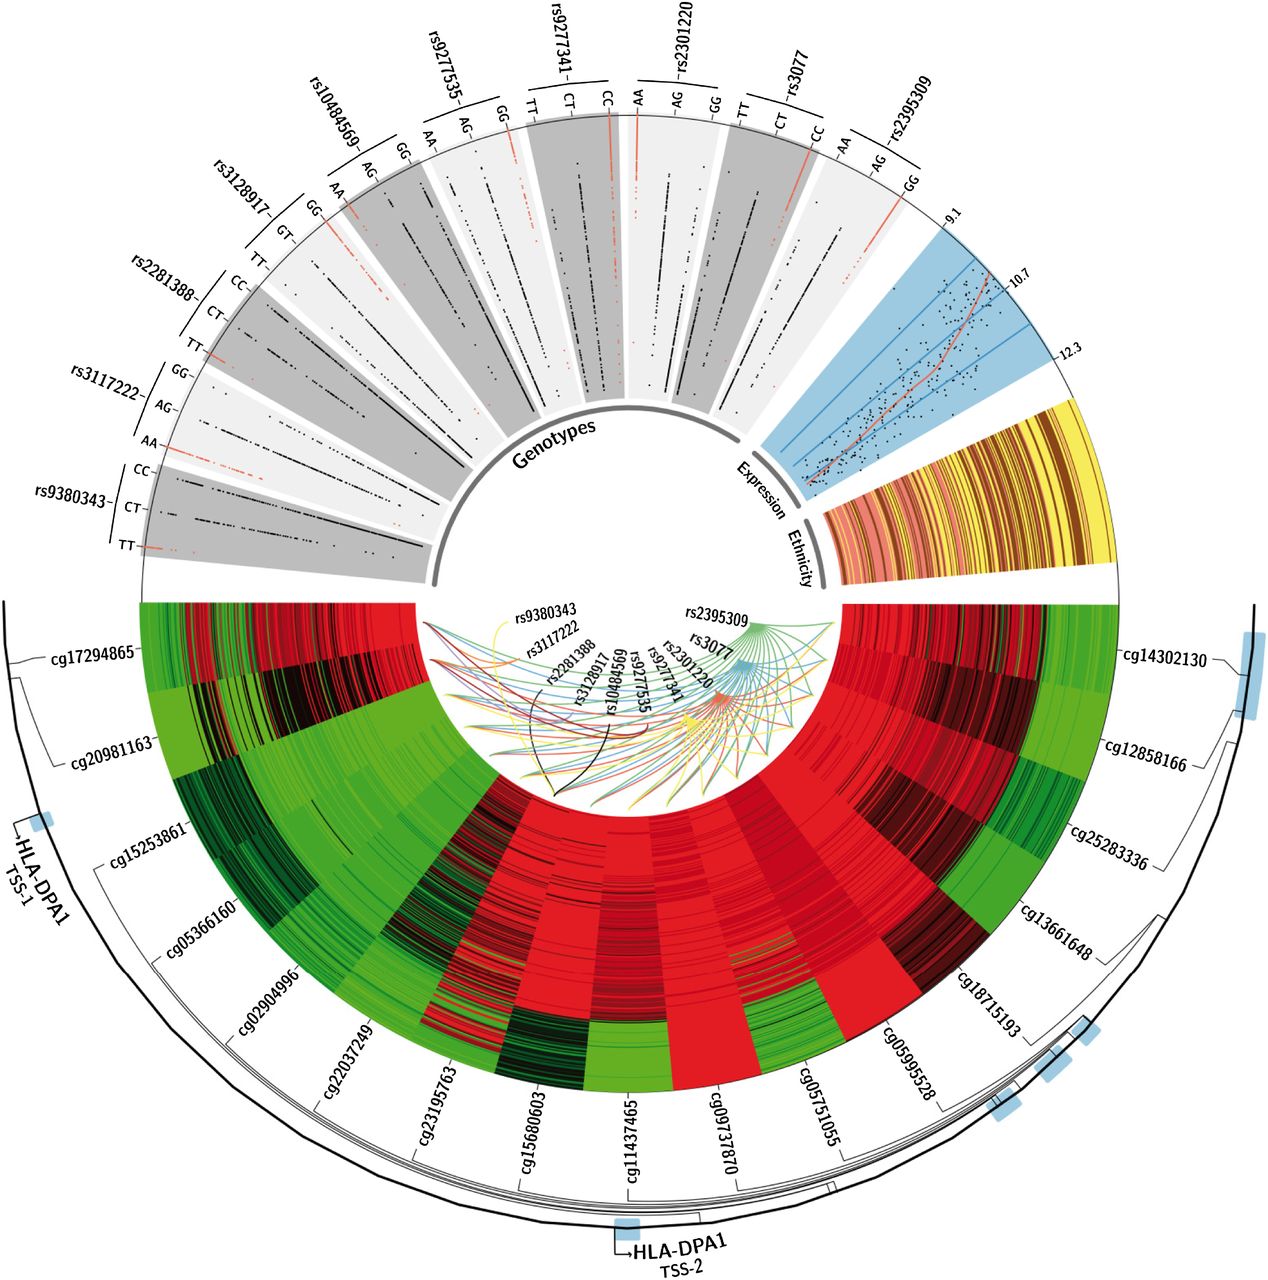
Genetic polymorphisms related to HBV infection influence DNA methylation and gene expression at the HLA-DPA1 locus. Using Circos (Krzywinski et al. 2009), the figure shows a schematic overview of the HLA-DPA1 locus and DNA methylation, genotype and expression data from African-American (brown), Caucasian-American (pink), and Han Chinese-American (yellow) individuals: DNA methylation levels (low: green; high: red) of CpG sites (n = 17) significantly correlated with the genotype of HBV infection-associated SNPs (n = 10) (Kamatani et al. 2009). Samples are ranked by mean CpG methylation values. SNP-CpG relations are displayed by colored lines. The genotype distribution of SNPs in the HLA-DPA1 locus is shown, which is significantly correlated with the level of CpG methylation (gray boxes; risk alleles are highlighted in red) (Kamatani et al. 2009). The distribution of expression levels of HLA-DPA1 is shown in the blue box.


